


Australian multi-regional input-output tables by IELab
IELab is a cloud pipeline for constructing multi-regional IO models. Recently a collection of these MRIO tables for Australia were made available for the community to use. The model resolution is 8 sub-regions (Australian states and territories) at 25 sectors, and cover the timeseries 2009-2018. For each year, the model contains margin layers: Basic prices, Trade margin, Transport margin, Taxes margin, Subsidies. The model is available from the IELab site: https://ielab.info/resources/117, and is also mirrored here: https://github.com/spottedquoll/aus_ielab_mrio. Use of this model is governed by a creative commons attribution non-commercial license.
Linking local environmental impacts to global drivers with nested MRIO models
In this recent research, we constructed hierarchically nested MRIO models. The term 'nesting' is used because a sub-national model can be transplanted into a global model to give more detail, somewhat like a Russian Matryoshka doll. More generally, local-scale could be nested within a sub-national MRIO, or regional-scale within a global country-scale MRIO.
These nested MRIOs open up new opportunities for investigating the linkages between sub-national production and consumption in different parts of the world via international trade, and the resulting environmental impacts. Incorporating sub-national spatial detail into these models is especially important for countries that exhibit significant regional variation in climate, resource endowment, production regimes, or international trade focus, such as the US, Canada, Brazil, Russia, India, China or Australia.
Water use in the Australian wine industry is used to demonstrate how this model would be useful. In the Figure, total water impacts of wine production is shown by n producing regions and m export destinations for each MRIO variant. Multipliers are shown for each of the n producing regions in panel (d), demonstrating the water consumption per economic unit of wine production (kL per $). These values are low for South Australia (SA) and Western Australia (WA) where water efficiency is high. The multipliers are also low for Rest of WA, Australian Capital Territory (ACT) and the Northern Territory (NT) since almost no wine is produced in these regions. However, after considering the embedded water in the supply chain, multipliers are very high for Queensland (Qld), followed by Tasmania (Tas) and Victoria (Vic).
Water-for-wine footprints (kL) for each MRIO variant – global (a), nested (b), sub-national (c), by producing region and export destination. Footprint panels use a common colour scaling. Multipliers (kL/$) are shown in (d) for producing regions only.

Circular economy models
Physical input-output models (PIOTs) provide a map of physical flows within economies and also between the economy and natural environment. PIOTs can be used to assess progress towards the circular economy by mapping material cycles within economies. However, these models can be difficult because physical data describing the economy is usually less detailed than monetary data, physical production data is often limited in the number of products covered, timeseries information contains gaps and data classifications change. We did some work to construct some PIOTs for Australia. The data limitations were overcome using an optimisation procedure that uses information from all published data sources and applies a conservation of mass principle.

The diagram below is shows simplified material in the PIOTs. The capital account is exogenous to the PIOT while interacting with it by acting as a sink for materials in new construction and a source of material from demolitions. RoW: rest of the world, RoE: rest of the economy. Once extracted from nature, some materials flow through the human-economy very quickly while others reside for extended periods, embedded in structures. However in the long-term, these materials embodied in building stock are returned to nature. On a geological time-scale, materials used by the human-economy are endognised to it and will eventually flow back to the natural environment.
One way to imagine the usefulness of PIOTs is to consider the construction industry. In the Australian economy, building construction is a significant driver of material consumption. If the magnitude and composition of these material flows were known, future resource requirements for building stock growth could be predicted. In addition, the availability of waste products from the dismantling of building stocks for use as inputs to new structures could be estimated. We could also determine if the domestic recycling infrastructure is sufficient to recover these wastes, and whether there are markets for recycled products.
In a circular economy, we are very interested in the flow of waste and secondary products back into new production. When waste displaces virgin material extraction from nature, many environmental impacts are avoided. Whether the substitution of waste for virgin material occurs in reality depends upon a number of factors, such as the relative costs of production inputs. There are technical limits to substitution, for example a high-quality and uniform glass waste stream is required for use in float-glass manufacturing. Domestic recycling infrastructure must also exist, for example in Australia, there is currently no suitable smelters for metal recovery from electrical and electronic equipment (e-waste) so this waste is exported internationally. The existence of domestic industries to soak-up the recycled products is also important.
The tables are available here: github.com/spottedquoll/aus-piots, for 1985 to 2012 at a resolution of 150 products/industries.
Resources
Isard, W. (1969). Some Notes on the Linkage of the Ecologic and Economic Systems. Papers in Regional Science, 22(1):85–96.
Duchin, F. and Levine, S. H. (2011). Sectors may use multiple technologies simultaneously: The rectangular choice-of-technology model with binding factor constraints. Economic Systems Research, 23(3):281–302.
Small scale agriculture in Ohara
Rice and vegetable production in Ohara, Kyoto prefecture.


Repairing our material relationships
We form complicated relationships with our material possessions. Some possessions are used to signal our affluence or tribal membership to other people. Other possessions are mainly practical, like washing machines or mops. We form emotional bonds with some possessions, as the objects tie us to relationships and places. However, in the past undoubtedly our society had different relationships with possessions. People likely had less possessions, owned them for longer and more often repaired them when they were broken.
To create these possessions, materials are extracted from the earth and transported thousands of kilometers along supply chains and through production layers, are transformed by high-temperature industrial processes and woven into complex structures before being delivered to consumers as finished products. In these transformations we use energy, emit greenhouse gases and cause other environmental impacts. In affluent countries, the environmental footprint of this material consumption continues to grow and the environment can no longer support this.
There are diminishing happiness returns from increasing material use, acquiring additional objects doesn't change our lives much. Although there may be a short-term high from the shopping and unboxing experience. The abundance and variety of material possessions in our lives in modern times probably reduces each item's perceived value. Turning towards owning fewer, higher quality and more treasured items provides a path out of this current predicament.
In order to own items for longer, we need to repair what we own already. Our relationship with repair has changed over time, in part because in the past resources and manufactured products were relatively more expensive compared to human labour. Repair services are generally labour intensive, and are supported by related activities such as troubleshooting, dismantling, cleaning, reconditioning, fabricating and re-manufacturing, which all require labour and makes them relatively more expensive. However, by repairing we are effectively substituting labour for resource use and hence lowering the environmental impact.
Embracing repair reduces the environmental burden of our material lifestyle in several ways. The material and energy cost of repair is usually far lower than manufacturing a replacement product. Not requiring a new product creates ripple effects across the global supply chain, as mining, transportation and manufacturing can all be avoided. There are however cases where repair is not appropriate, for example when a product is energy intensive during it's lifetime and there have been significant energy efficiency improvements to new models.
There are other barriers to repair beyond labour cost, for example increasing product complexity, particularly in technology. The specialisation, intricacy and degree of substance mixing in electronics can make them difficult to repair and reuse. In addition, the industrial processes to separate and recover the constituent metals is energy intensive. Other barriers to repair include 'piracy' protection that prevents consumers from repairing their own products, access to spare parts by both consumers and repair shops, products designed to inhibit repair, and obsolescence created by software updates or lack of future updates.
Ideally, consumers would have access to quality products, constructed in a way that encourages repair, and for which spare parts are available. To achieve this, regulatory reform will probably be required to gently push/coerce companies to support this. For example, legislation affirming the rights of individuals to repair the devices they own. Also, laws facilitating third-party repair shops so that consumers are not locked into OEM repair policies. Currently the cost of disposal for unwanted products is largely socialised, with society paying the cost of finding waste management solutions. However, companies should be more involved at the product end-of-life through strengthening extended producer responsibility laws.
The act of repair seems to involve a certain humanness, it requires some care to repair an object. Perhaps in the past our relationships with other humans was more closely connected to our relationships with possessions. For example, the disappearance of trades that support repair from our communities highlights the diminished role they play in our lives; furniture makers, hatters, knife sharpeners, cobblers, watchmakers and metal shops. Repair-by-humans may also foster meaningful work opportunities, if the repair requires skill and tradecraft to perform and the work is valued by society. Though, some of these skills are being fostered and rekindled in maker spaces.
This requirement of humanness is not to diminish the potential role of AI and new technologies. Artificial intelligence may develop that makes diagnosing problems in complex products easier. Also, 3D printers allow us to construct spare parts when the manufacturers can not, or will not, supply them. This improves the capability of communities to repair items locally, making them more resilient to disruptions in global production networks, as recent pandemics have shown us is probably important.
Resources
Thomas O. Wiedmann, Heinz Schandl, Manfred Lenzen, Daniel Moran, Sangwon Suh, James West, and Keiichiro Kanemoto, 2015, The material footprint of nations, PNAS, https://doi.org/10.1073/pnas.1220362110
Shigemi Kagawa, Keisuke Nansai, Yasushi Kondo, Klaus Hubacek, Sangwon Suh, Jan Minx, Yuki Kudoh, Tomohiro Tasaki, and Shinichiro Nakamura, 2011, Role of Motor Vehicle Lifetime Extension in Climate Change Policy, Environmental Science & Technology, https://doi.org/10.1021/es1034552
The work of Cory Doctorow: https://craphound.com/tag/right-to-repair/
Hamilton, Clive and Richard Denniss, 2005, Affluenza: When Too Much Is Never Enough, Allen & Unwin
Electronic Frontier Foundation: https://www.eff.org/issues/right-to-repair
Tanya Harrod, 2013, Visionary rather than practical: craft, art and material efficiency, Philosophical Transactions of the Royal Society A: Mathematical, Physical and Engineering Sciences, https://doi.org/10.1098/rsta.2011.0569
Sustainability strategy USyd
I was recently involved in the development of the University of Sydney’s sustainability strategy. This is a great step forward for the university and I hope the implementation goes well. Hopefully, a future iteration of the strategy will also capture supply chain emissions, for example, emissions embodied in materials used in the university’s construction projects.
We aim to:
- achieve net zero emissions from Scope 1 and 2 sources by 2030
- source 100% of electricity from renewable sources by 2025
- generate 3 megawatts on-site renewable electricity by 2025.
Travels with Charley
John Steinbeck - Travels with Charley
Short supply chains
There are some advantages to short, low-complexity supply chains. One advantage is the reduction in abstraction. If the consumer can imagine the place where the product is from, then perhaps the environmental impacts of production become more tangible. Another advantage is the consumer may have more influence over a shorter supply chain. When the producer exists in approximately the same region as the consumer, it may be easier to exert social pressure on the producer to act responsibly.
However, although supply chains may appear “short”, the higher-order production layers are hidden to us. These production layers contain information about the impacts occurring further up the supply chain. For example, in the case of food products, the impacts occurring upstream from the farm in machinery, fuel and chemical manufacturing. The higher-order production layers can be unravelled using environmental-economic models.
While “short” or "simple" may be a useful heuristic, it is not necessarily "better". For example, we could imagine a product that comes from further away but is manufactured using lower-impact production processes than those available locally. In this case the reduction in environmental impacts in production may outweigh the increase in transport emissions and abstraction.
New Zealand peanuts and Australian salt into Japan’s final demand.


Hokkaido butter


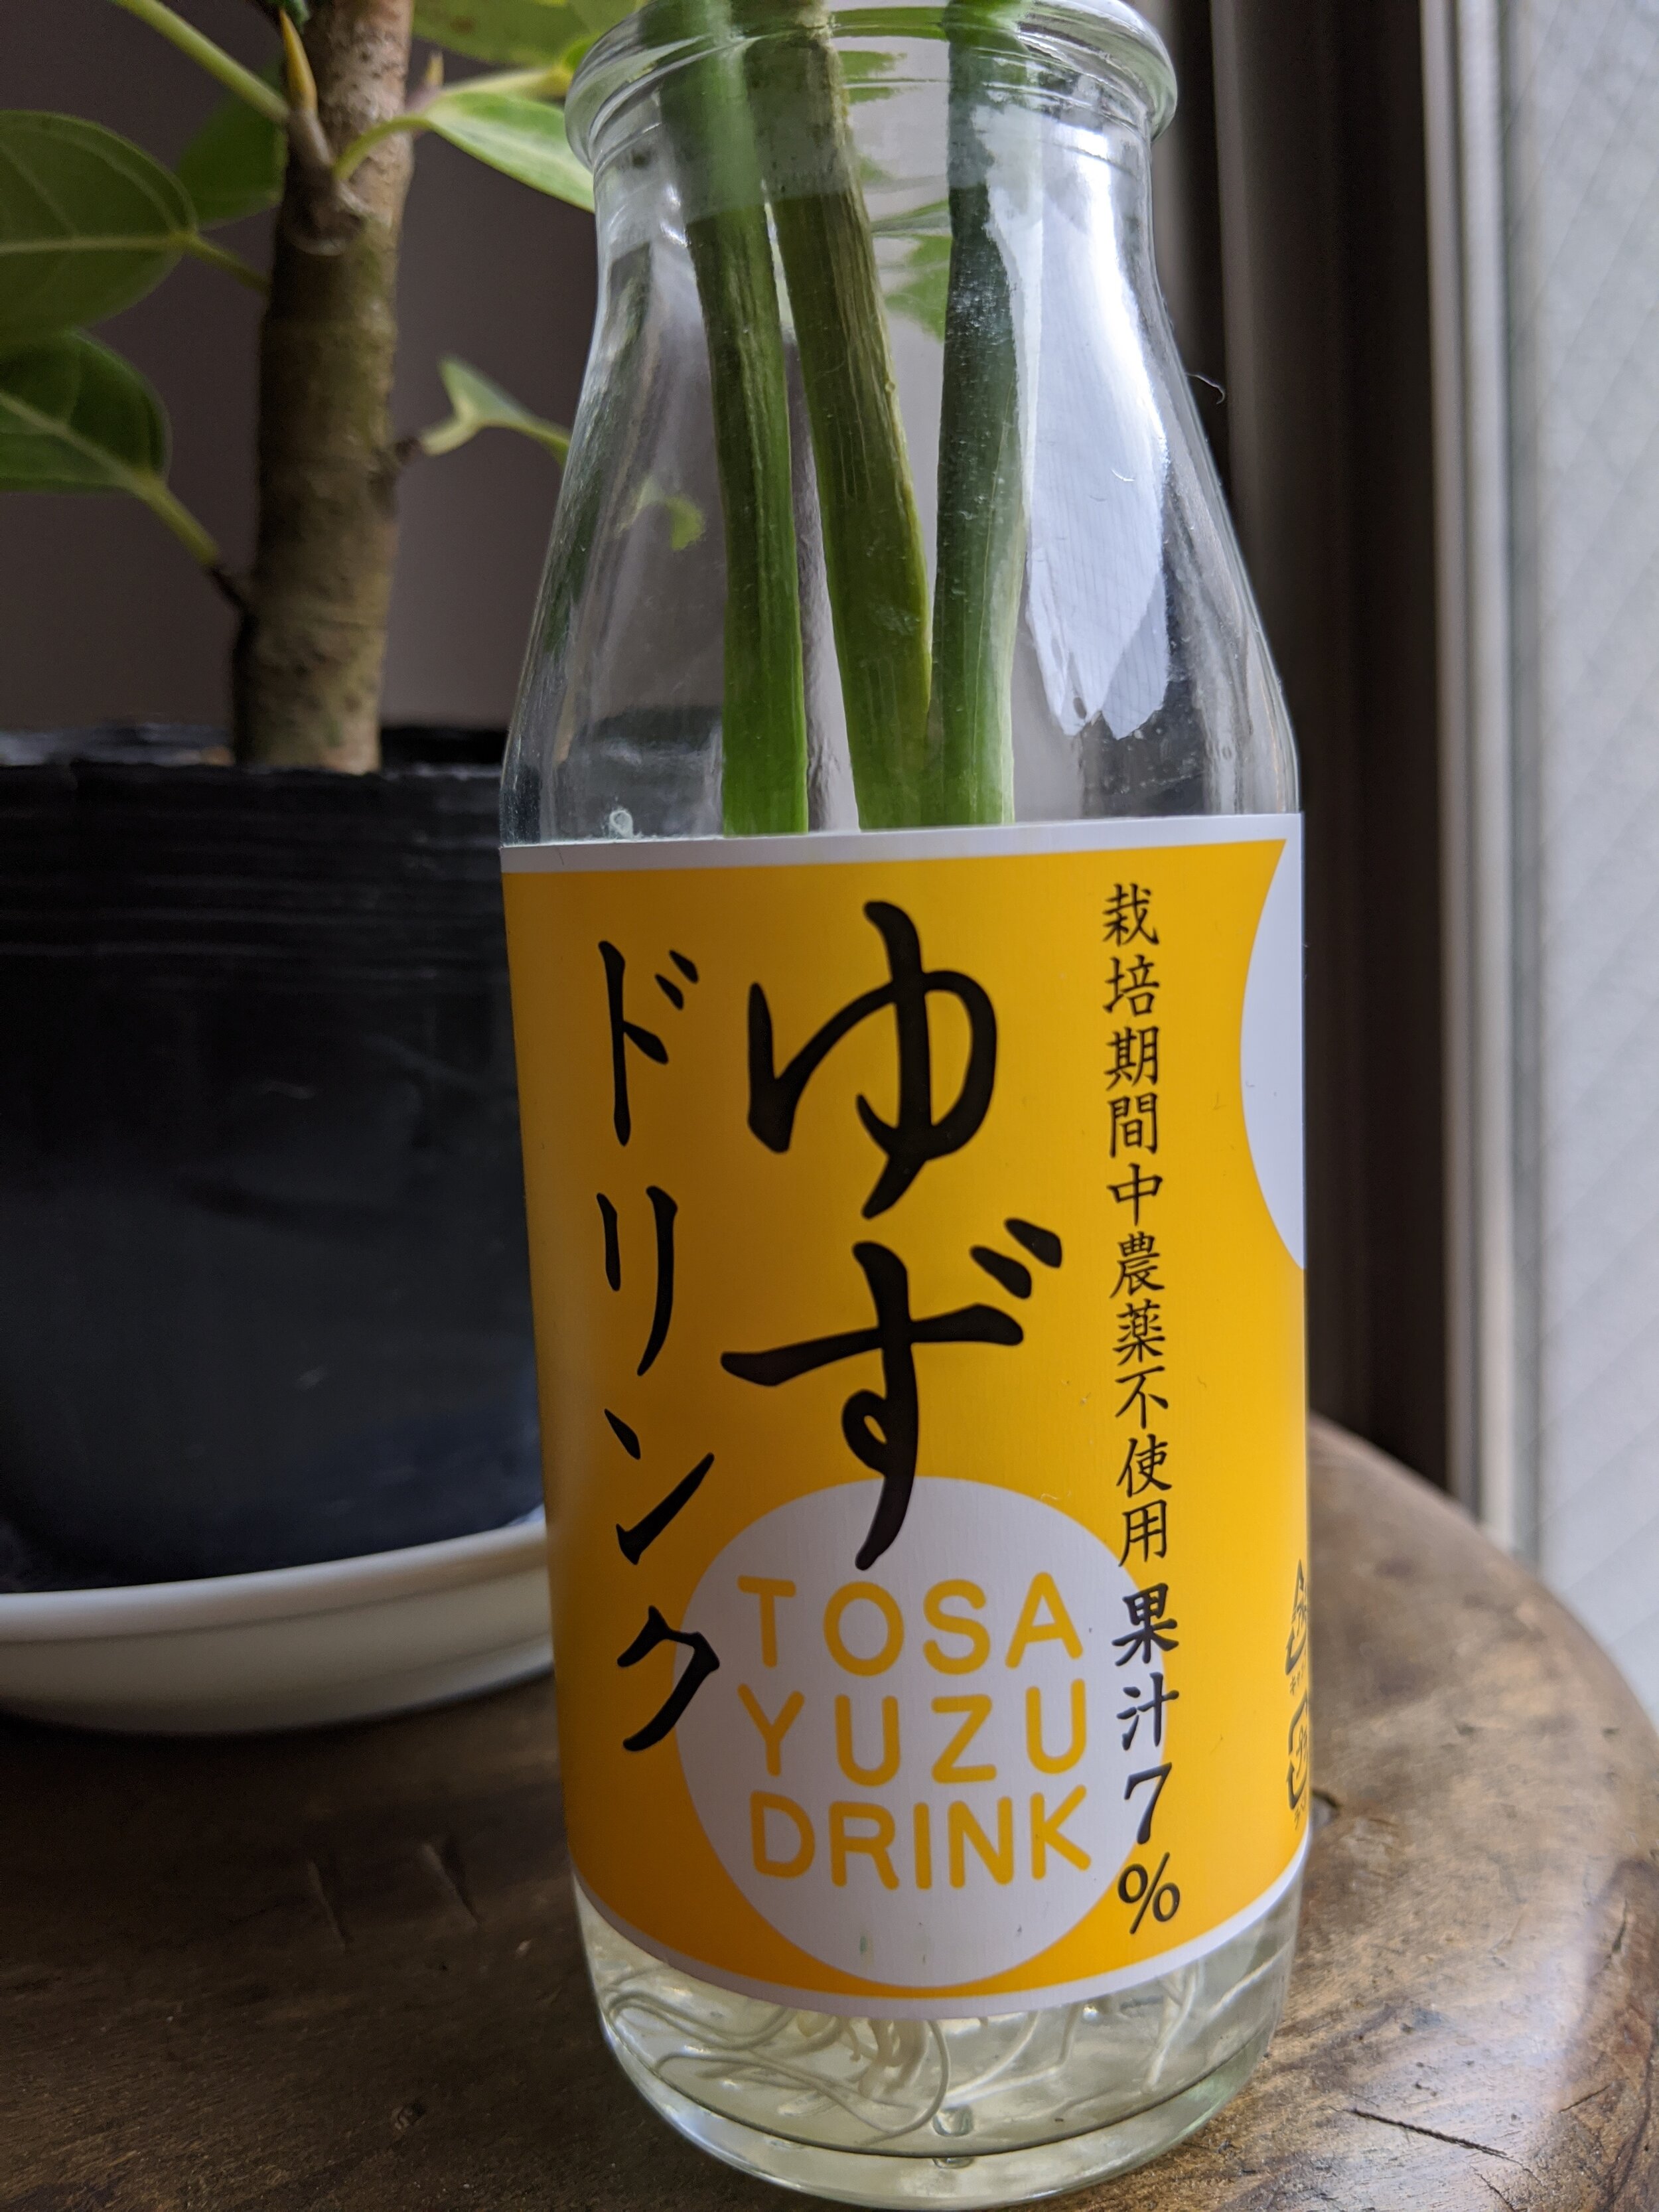
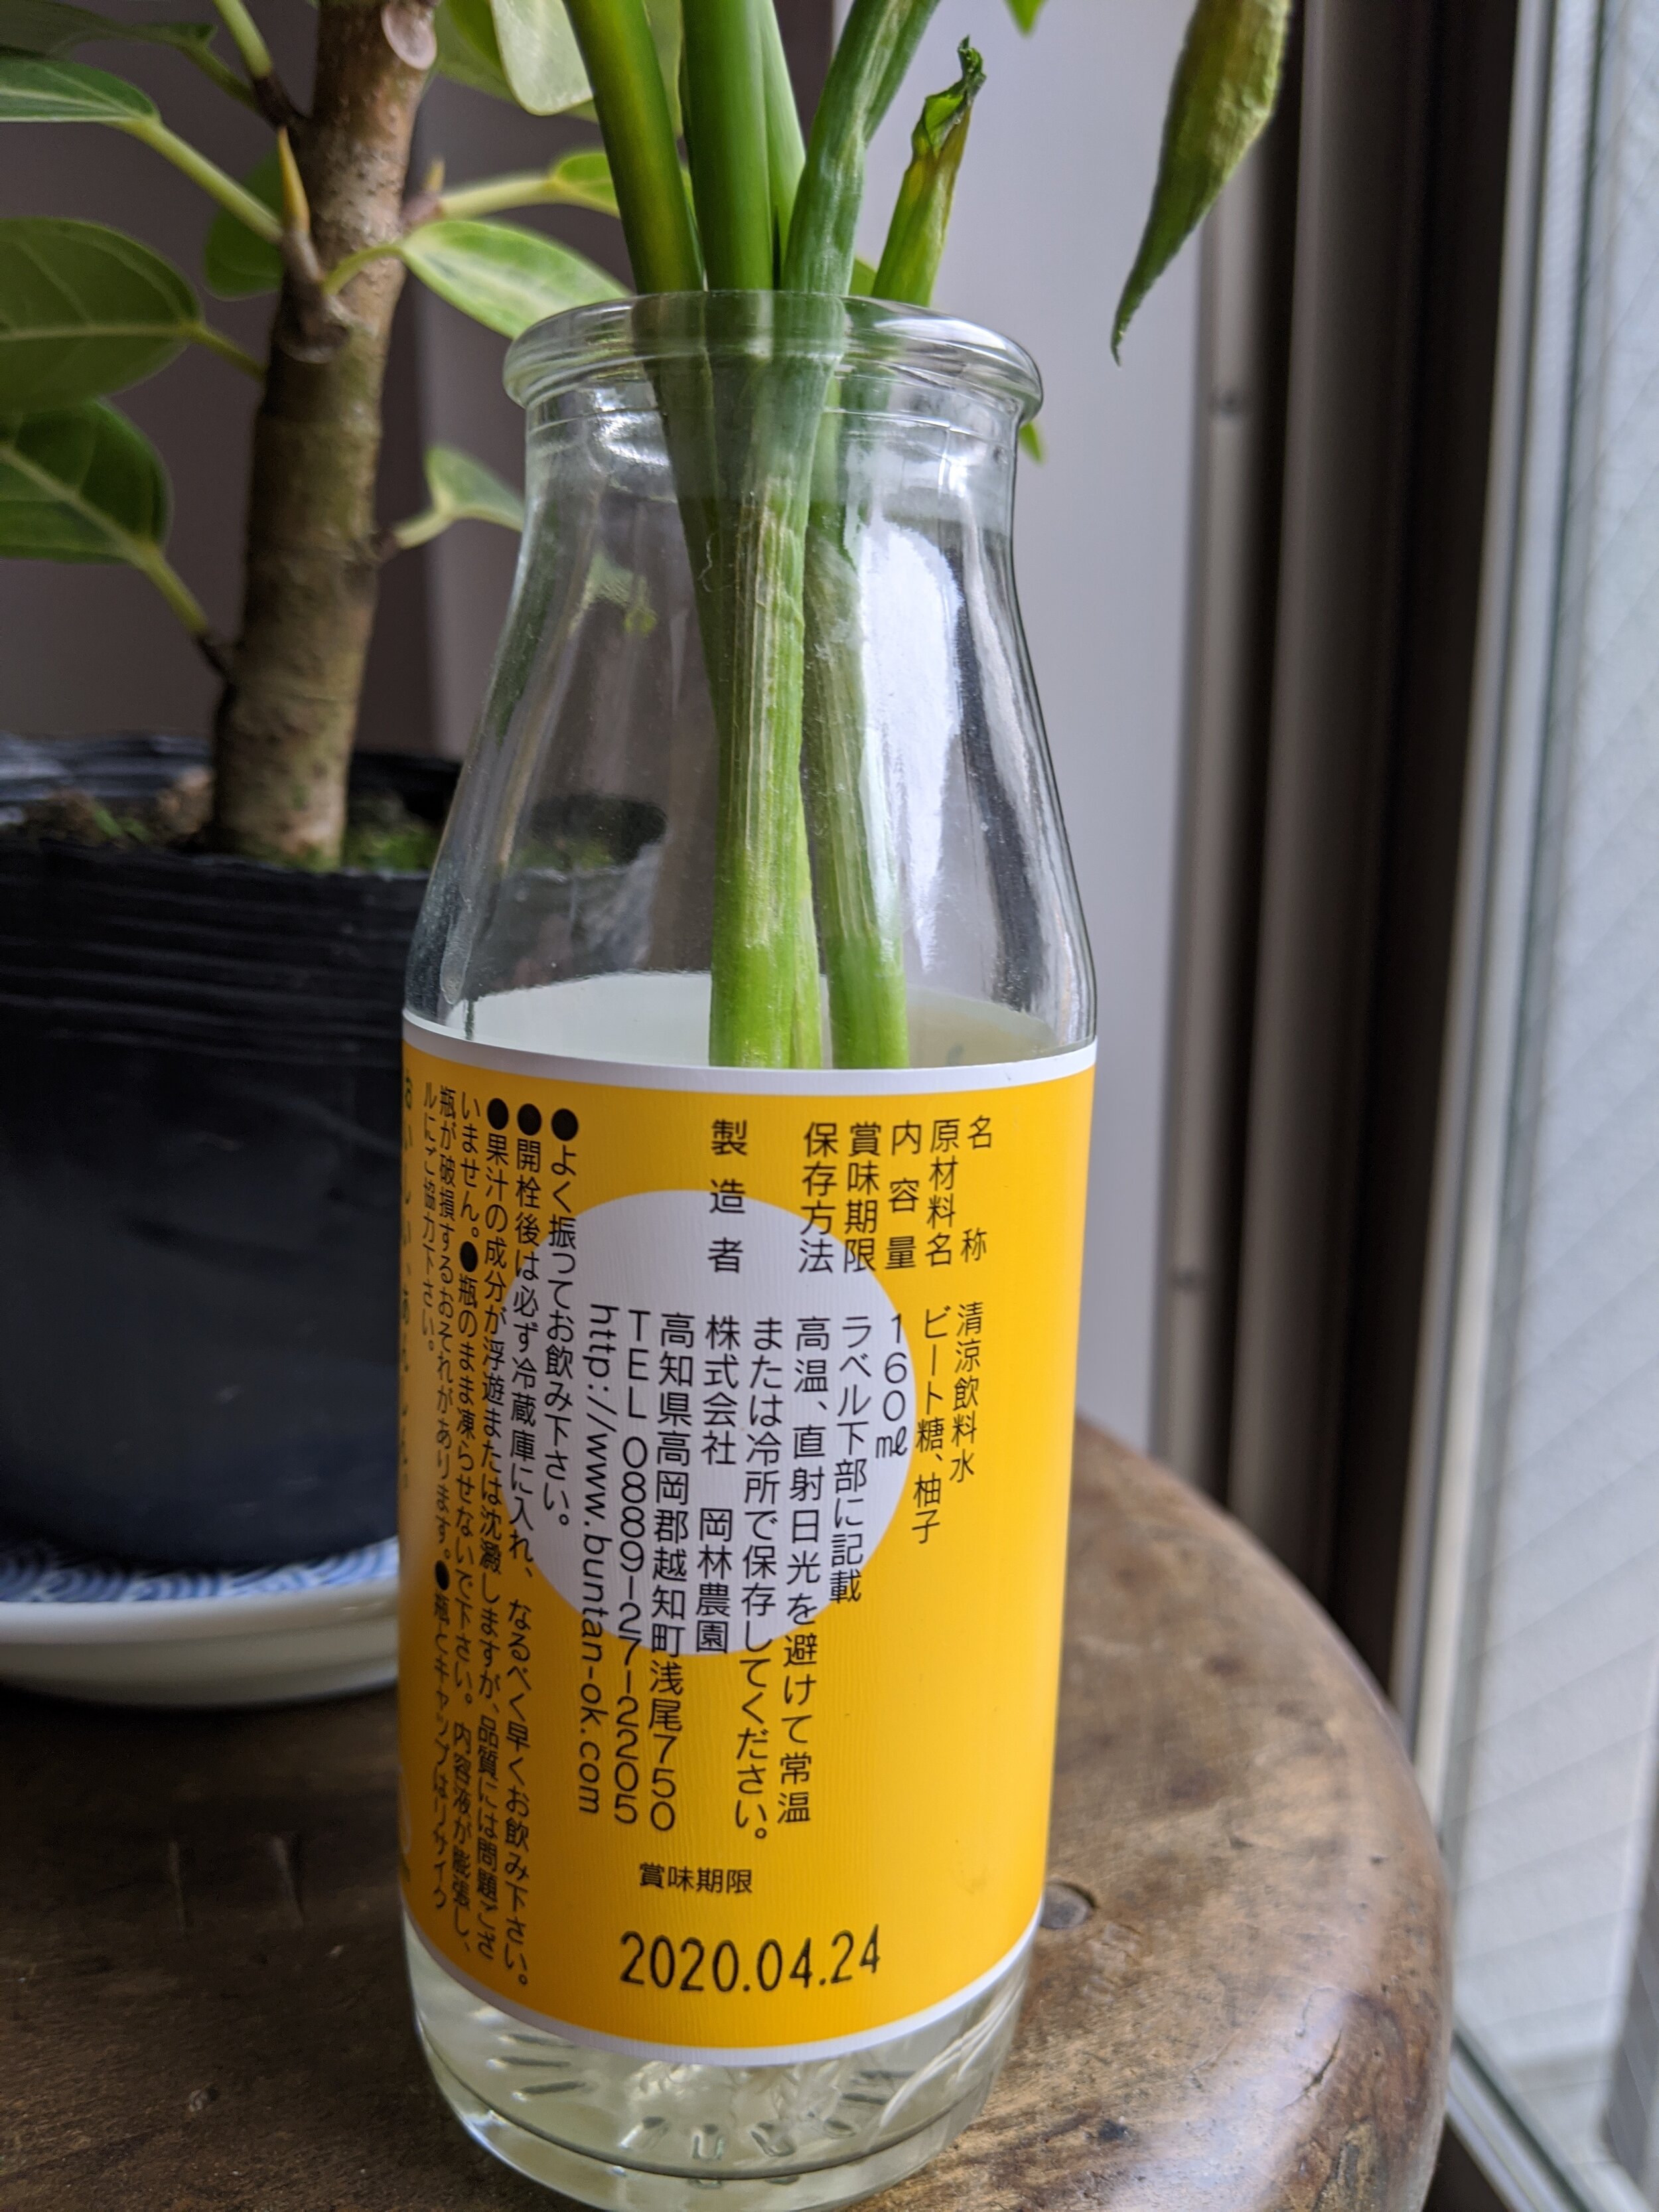
Yuzu (Japanese lemon) and sugar from Kochi
Consumers, deforestation and malaria risk
In a recent paper, we linked malaria and deforestation through supply chains to consumers. Deforestation can increase the transmission of malaria. In this study, we build upon the existing link between malaria risk and deforestation by investigating how the global demand for commodities that increase deforestation can also increase malaria risk. We use a database of trade relationships to link the consumption of deforestation-implicated commodities in developed countries to estimates of country-level malaria risk in developing countries. We estimate that about 20% of the malaria risk in deforestation hotspots is driven by the international trade of deforestation-implicated export commodities, such as timber, wood products, tobacco, cocoa, coffee and cotton. By linking malaria risk to final consumers of commodities, we contribute information to support demand-side policy measures to complement existing malaria control interventions, with co-benefits for reducing deforestation and forest disturbance.
This figure shows trends in forestation, trade in deforestation-implicated products, and post-2000 malaria footprints. Panels (a), (b) and (c) each show a collection of net exporting (magenta) and net importing (green) countries. Axes are logarithmic, with negative values representing deforestation (for example −1 equals a cumulative 10,000 km2 forest loss since 1995) and product import (for example −2 equals a US$100 bn import). Plotted points represent the years between 2000 and 2015 in 3-year intervals where line thickness is proportional to net malaria risk trade, and net exporters represented by a solid line, net importers by a dashed line. The time series proceeds from the origin outwards and also with increasing line thickness. As time progresses, richer countries import more deforestation-implicated products which causes deforestation in poorer countries, while at the same time preserving more of their own forest.
Searching for Storks
A trip to Hachigoro Toshima wetland, a Ramsar listed wetland near Kinosaki. I was looking for the Oriental Stork, however unfortunately all the storks were away travelling. Luckily there were ducks and heron aplenty. The oriental stork was considered extinct in Japan since the 1970s however a breeding program has since established a wild population again.


The trip did remind me of Aldo Leopold’s beautiful writing about cranes in A Sand Country Almanac:
A sense of time lies thick and heavy on such a place. Yearly since the ice age it has wakened each spring to the clangor of cranes. The peat layers that comprise the bog are laid down in the basin of an ancient lake. The cranes stand, as it were, upon the sodden pages of their own history. These peats are the compressed remains of the mosses that clogged the pools, of the tamaracks that spread over the moss, of the ice sheet. An endless caravan of generations has built of its own bones this bridge into the future, this habitat where the oncoming host again may live and breed and die.
…
And so they live and have their being- these cranes – not in the constricted present, but in the wider reaches of evolutionary time. Their annual return is the ticking of the geological clock. Upon the place of their return they confer a peculiar distinction. Amid the endless mediocrity of the commonplace, a crane marsh holds a paleontological patent of nobility, won in the march of aeons, and revocable only by shotgun. The sadness discernible in some marshes arises, perhaps, from their once having harbored cranes. Now they stand humbled, adrift in history.
A place by the fire
An essay submitted to Gill Owen Essay Prize and also published on Renew Economy in 2018:
A place by the fire: energy efficiency and equitable access to energy services
The call for us to respond quickly to climate change is becoming more urgent. The recently released IPCC report [1] reiterated the urgency by which we should reduce greenhouse gas (GHG) emissions if we are to have a chance at avoiding runaway climate change. In the face of this crisis, we should employ all available methods to reduce emissions. Energy efficiency offers a cheap and effective way to reduce energy consumption and the emissions associated with electricity generation and other energy services. While not a solution in itself, efficiency is a complementary strategy that can be employed in conjunction with other approaches such as renewable energy and decreases in material consumption.
There is evidence to suggest there is a significant reserve of energy efficiency potential within the Australian economy. For example, the City of Sydney is aiming for a 31% energy saving by 2030 whilst saving over $200 million dollars [2]. A 13 to 22 percent reduction in GHG emissions was estimated to have been achieved as a result of a NSW government program to build more efficient residential buildings [3]. The federal government’s Energy Efficiency Opportunities program found large potential for savings among Australia’s largest industrial energy users [4]. A study by McKinsey & Co found large potential for both residential and industrial energy efficiency savings, at a negative abatement cost [5]. Energy efficiency in industry is as important as household efficiency, since industrial efficiency provides a large source of savings and also industrial energy costs are baked-in along supply chains of final products purchased by consumers.
Recently energy politics in Australia has focussed on rising electricity prices, however historically Australia enjoyed reasonably low electricity prices [6]. Low prices can work as a disincentive for energy efficiency as higher prices may encourage consumers to reduce their costs by using energy more frugally. However, higher energy prices can disadvantage low income households disproportionately as energy spending constitutes a larger fraction of their total income. These households cannot easily reduce essential energy services such as lighting, cooking and space heating/cooling in the face of higher prices. Furthermore, if climate change causes more severe and frequent heatwaves, access to air-conditioning may become a public health issue. The dilemma therefore is how to reduce our energy use while simultaneously ensuring equitable access to energy services.
Low income households are adversely affected by high energy prices and barriers which prevent them from accessing energy efficient technology that would help them avoid extra costs. The minimum energy performance standards scheme has been very successful at driving improvements in appliance efficiency [7]. However, there are a range of reasons why low-income households may not have access or be using the most efficient models. An example of this are tenants who are locked-in to whichever technology is installed in their rental property, e.g. hot water systems. In addition, they may not be able to afford a new efficient appliance and be stuck with old or broken appliances. One solution is to assist low-income households in purchasing new efficient appliances by providing access to credit [8]. We can also mandate the disclosure of rental property energy performance to encourage landlords to make efficiency investments.
If we consider access to energy services a necessity and a basic human right, then we should consider means to ensure equal access. Going further, we might see that once basic energy needs have been satisfied, further energy use is ‘luxury’ or discretionary. Thinking along these lines, others have considered a progressive consumption-based tax on energy, although this may be difficult to implement [9]. Alternatively, lower energy tariffs or rebates could be offered to low-income households (there are examples of this policy in California [10] and also NSW [11]). This ‘duty-of-care’ to provide essential services to the vulnerable, elderly and low-income earners was something Gill Owen advocated for in much of her work [12].
The provision of public transport is an excellent example of a policy that achieves both energy and social equity outcomes. Low income earners are exposed to rising fuel prices which can inhibit their ability to travel to their place of employment, particularly when living in areas without adequate public transport. In general, public transport has a lower energy intensity than private car transport and the emissions perspective improves further when electric trains, trams and buses are powered cleanly using renewable electricity. A shift away from private car transport would also reduce Australia’s reliance on liquid fossil fuel imports, which has the potential for disruption [13]. Public transport use also has positive effects on our urban spaces and communities, which can become more vibrant when more people are out and about using public transport. There may also be public health benefits as people engage in more incidental exercise associated with public transport use.
Part of the recent rise in electricity prices has been attributed to profit-maximising behaviour by the energy retailers and network operators [14]. A similar situation exists in the natural gas market, with households paying high prices as gas extractors prefer to sell to the profitable export market rather than satisfy domestic demand [15]. One solution to this is for communities to take control through community-owned not-for-profit renewable energy projects. There are numerous examples of successful community owned renewable energy generators in Australia [16]. These entities allow communities to reflect values they consider important, for example, ensuring equal access to energy and profits remaining in the community. This also provides communities autonomy over their clean energy future without requiring federal energy policy. Such networks also provide a way for low-income households to participate in renewable energy, as they are likely priced-out of the rooftop solar market. In remote and rural areas, these projects can be paired with new microgrid technology [17].
Providing energy services to everyone in our community, including the most vulnerable, is our societal responsibility. Equally, we must respond quickly and decisively to cut our GHG emissions to avoid dangerous climate change. Fortunately, there are number of strategies we can employ to achieve these dual outcomes. Energy efficiency and equity is an important topic in the context of rising inequality in developed countries, but it also requires us to consider more broader questions such as – who should bear the burden of climate change mitigation? Globally there are approximately 1 billion people who do not have access to electricity and our challenge is to meet their needs while dramatically reducing global emissions.
[1] Intergovernmental Panel on Climate Change, https://www.ipcc.ch/
[2] City of Sydney, 2015, Energy Efficiency Master Plan, https://www.cityofsydney.nsw.gov.au/__data/assets/pdf_file/0020/241436/Energy-Efficiency-Master-Plan-low-res.pdf
[3] Energy Australia, BASIX Monitoring Report: Electricity Consumption for 2007-08 and 2008-09, https://www.basix.nsw.gov.au/iframe/images/energyMonitoringReport2007-2009.pdf
[4] The Energy Efficiency Opportunities (EEO) program: https://www.eex.gov.au/large-energy-users/energy-management/energy-efficiency-opportunities
[5] McKinsey and Co, 2008, An Australian Cost Curve for Greenhouse Gas Reduction, https://www.mckinsey.com/business-functions/sustainability-and-resource-productivity/our-insights/an-australian-cost-curve-for-greenhouse-gas-reduction
[6] https://www.abc.net.au/news/2018-07-18/electricity-price-rises-chart-of-the-day/9985300
[7] Energy Efficient Strategies, Whitegoods Efficiency Trends in Australia 1993-2014. 2016, Department of Innovation, Industry and Science
[8] http://goodshepherdmicrofinance.org.au/media/energy-efficiency-program-drive-financial-inclusion/
[9] Pikkety, T, 2015, About "Capital in the Twenty-First Century", The American Economic Review
[10] California Alternate Rates for Energy (CARE): http://www.cpuc.ca.gov/General.aspx?id=976
[11] Low Income Household Rebate: https://www.service.nsw.gov.au/transaction/apply-low-income-household-rebate-supply-customers
[12] Owen, G, 2005, Sustainable development duties: New roles for UK economic regulators, Utilities Policy
[15] http://ieefa.org/ieefa-australia-a-gas-cartel-run-amuck/
[16] For example: http://www.sydneyrenewable.com/, https://www.energy.vic.gov.au/renewable-energy/community-energy
[17] For example, Okra Solar: http://www.okrasolar.com/