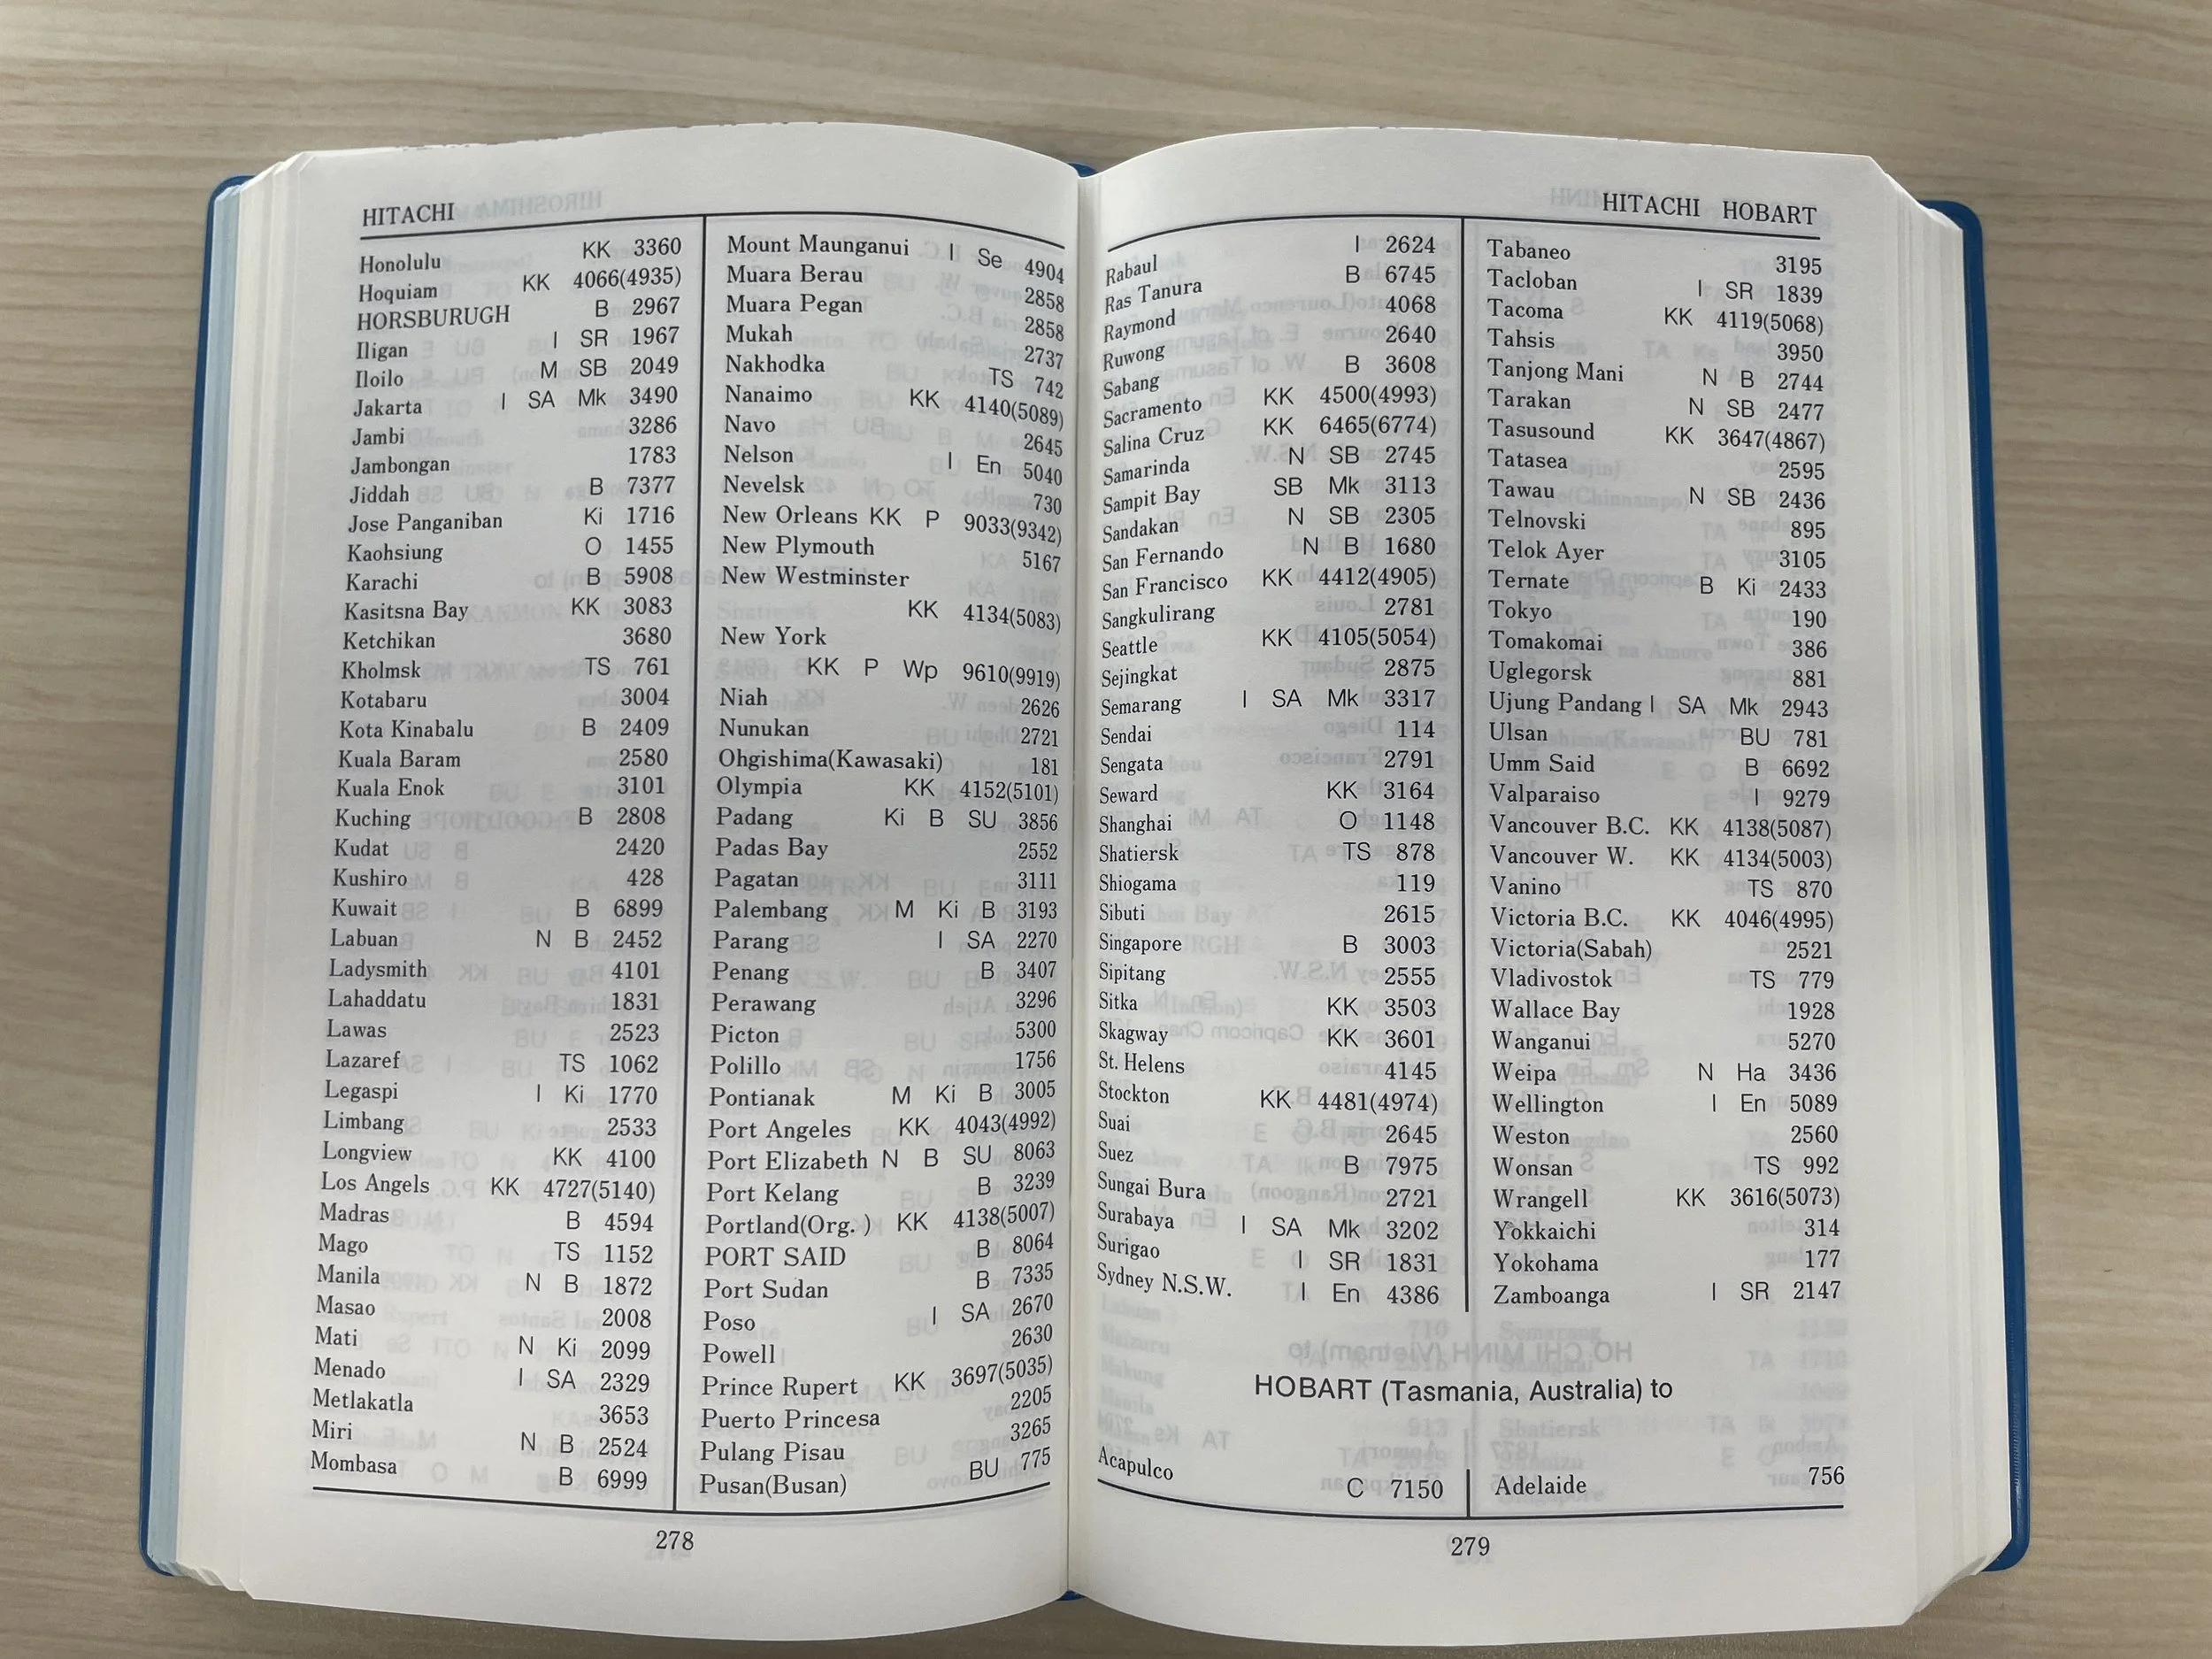
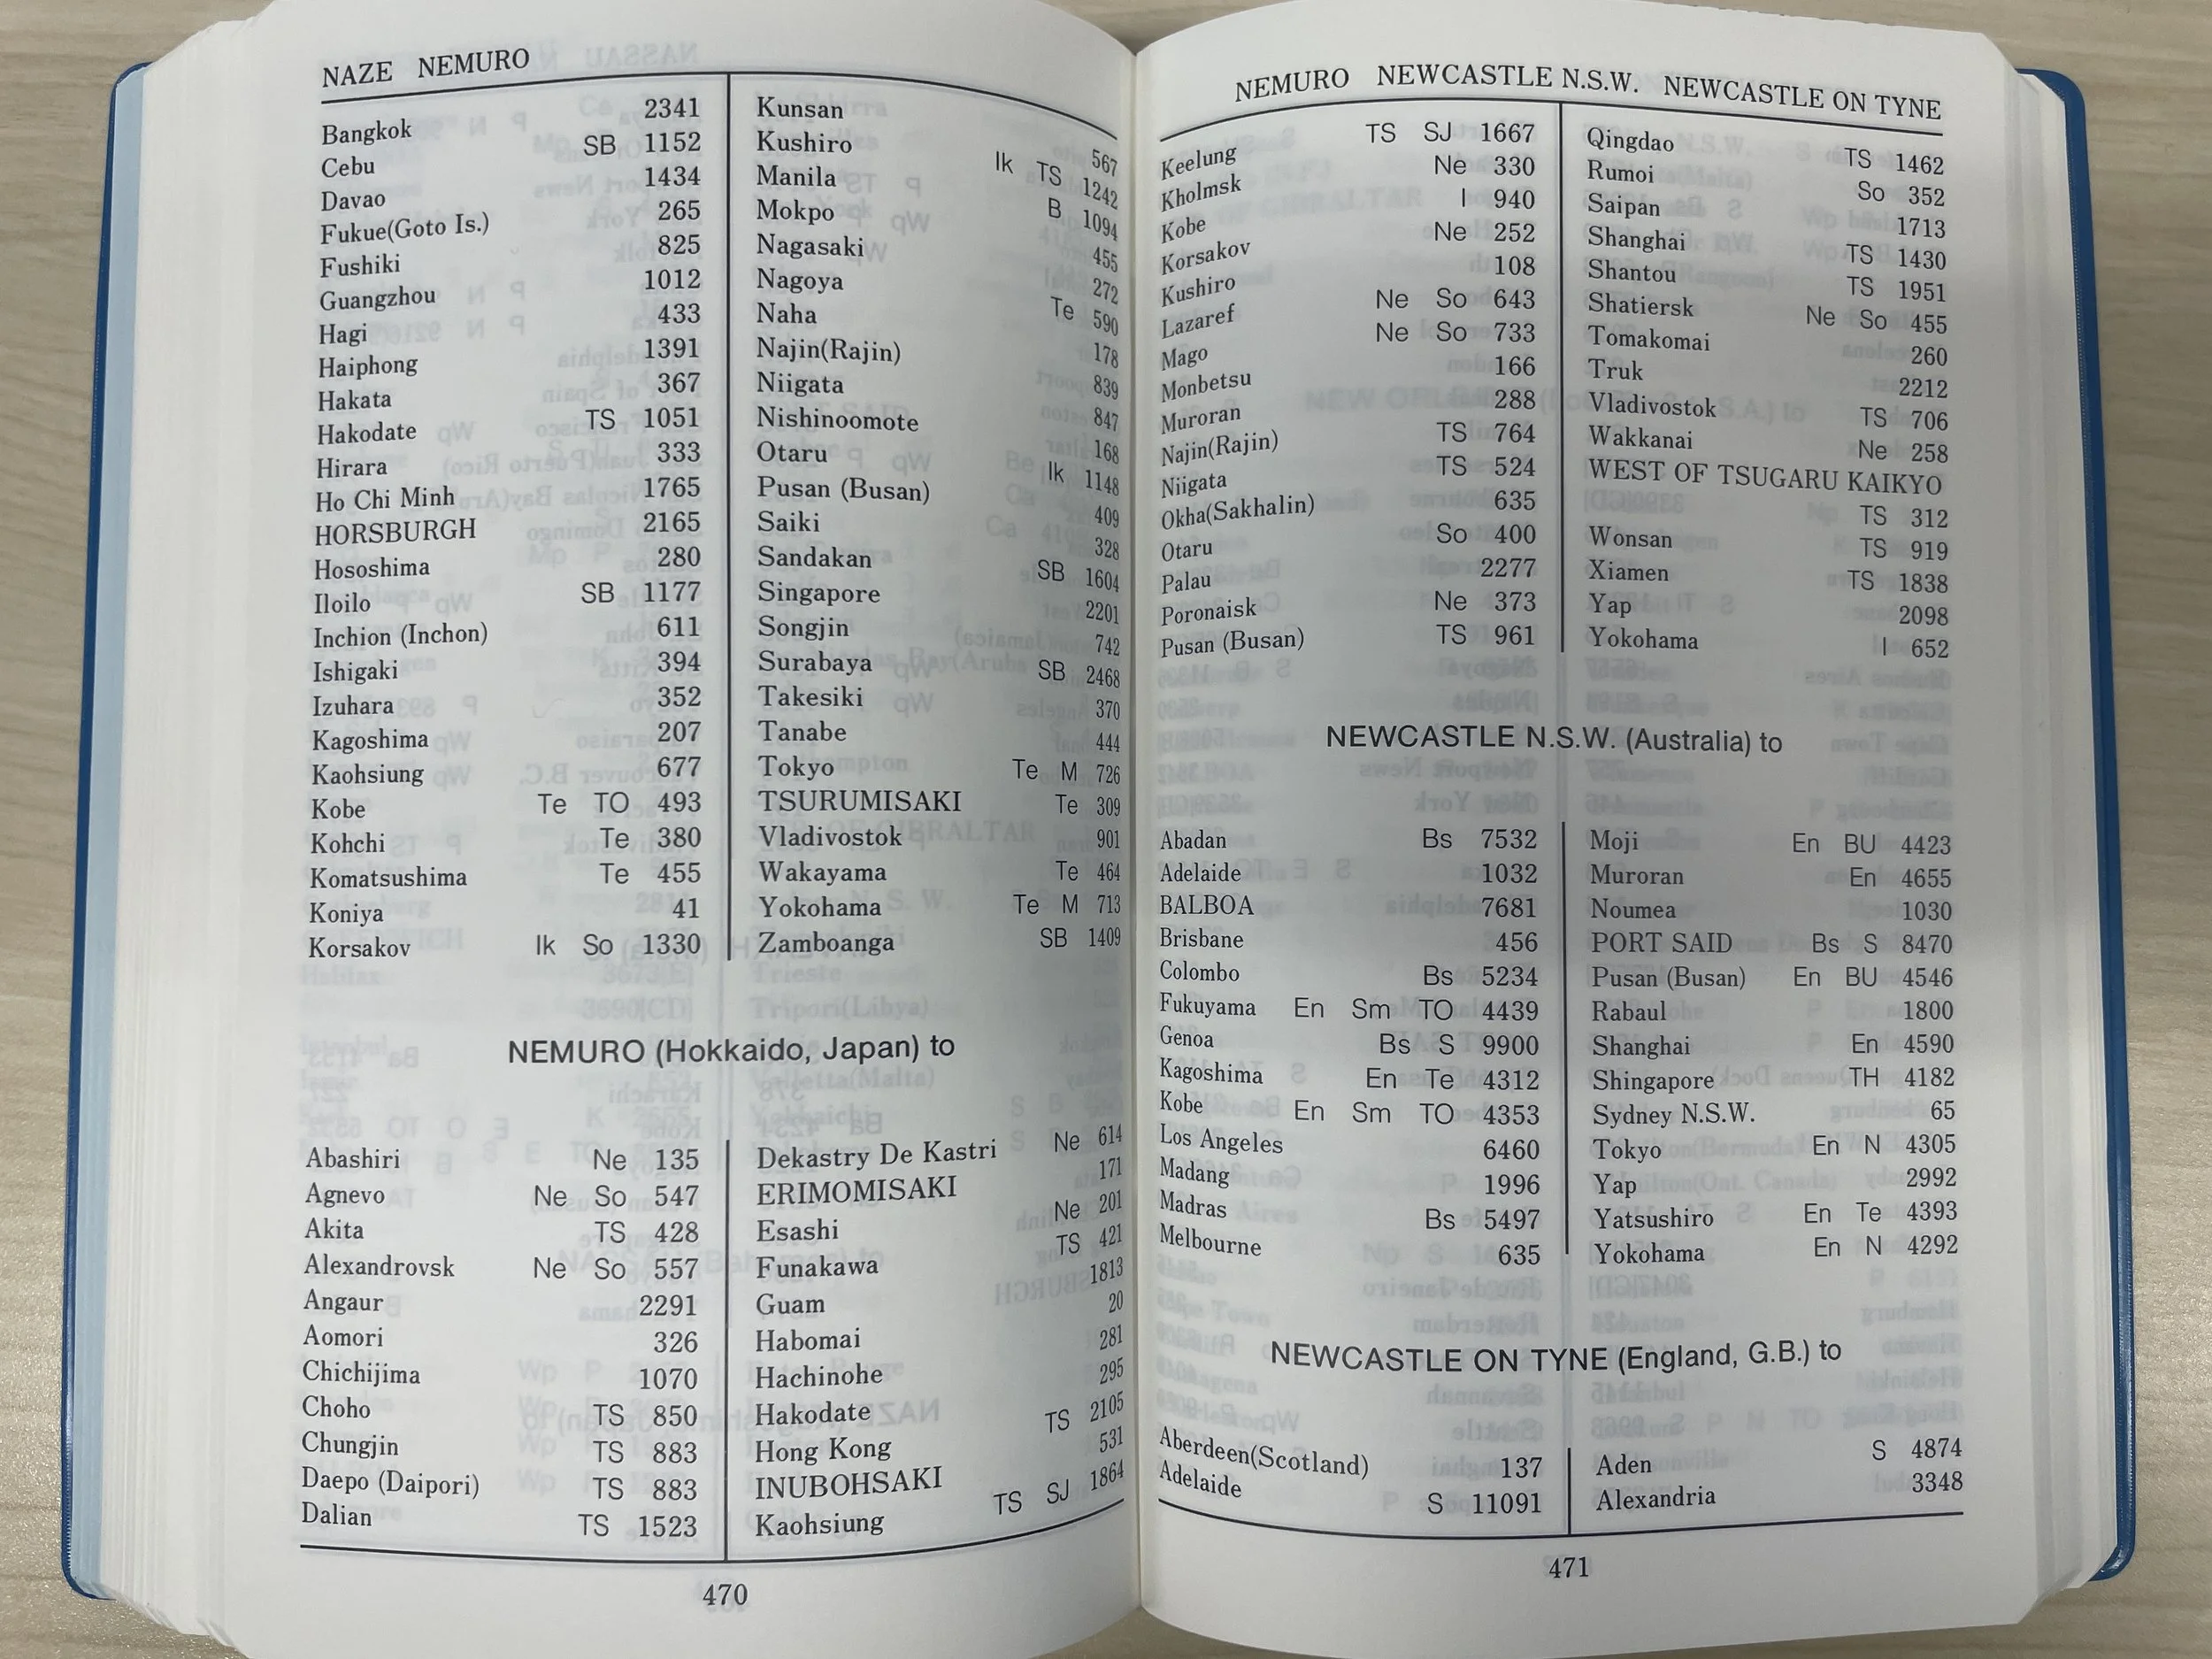
Before satellite AIS, we relied on shipping schedules and distance tables. The book contains the distances between all major world ports and ports in Japan.


Energy efficiency and decarbonisation pathways for Australian public hospitals
Hospitals are significant contributors to the carbon footprint of healthcare. Hospitals can be particularly energy-intensive as these facilities operate continuously, have strict space condition requirements and contain unique energy loads. Energy efficiency is a low-cost decarbonisation pathway for hospitals and offers co-benefits such as improved reliability and resilience, however the magnitude of this opportunity can be difficult to quantify. In this study, the energy efficiency potential of Australian public hospitals in Victoria, Queensland and South Australia is estimated using the NABERS Energy for public hospitals dataset. NABERS is an energy performance indicator that measures operational energy use in hospitals, and other large building types, and encodes information about the energy efficiency potential. In this study, the application of energy efficiency, electrification and grid decarbonisation is modelled from 2024 to 2040. We estimate that by 2040, energy efficiency has the potential to deliver a 15-20% reduction in energy consumption to the existing hospital stock. The combination of efficiency and electrification has the potential to reduce the energy intensity of hospital operations by about 40%. By 2040, emissions are projected to fall by 80% using the combination of decarbonisation strategies. The implementation of decarbonisation strategies is modelled probabilistically and a Monte Carlo approach used to derive uncertainty estimates for these predictions. This analysis assumes that hospital heating and cooling systems have the largest potential for efficiency savings. Quantifying the contribution of these healthcare decarbonisation strategies can assist policymakers in allocating appropriate resources for implementing efficiency and other decarbonisation measures.
This research was published recently in the Journal of Industrial Ecology: https://link.springer.com/article/10.1007/s44498-026-00069-1
Projected hospital futures under multiple decarbonisation scenarios, with scenarios applied cumulatively. Panels (i) and (ii) show emissions and energy reduction waterfall plots by scenario, (iii) and (iv) emissions and energy projections with confidence bounds (confidence bounds shown in a lighter shade around the mean line), (v) indexed bed-days emissions and energy intensity and (vi) indexed fuel consumption
Panels (i) and (ii) show 2D histograms of transitions from initial to final ratings, with colour scaled proportionally to the number of hospitals in each bin, as observed in the raw data. Note the transitions from initial to final rating states are shown and not the intermediate states. Panel (i) shows all hospitals while (ii) shows hospitals filtered for ‘best performers’. Proportions of the hospital stock in each NABERS rating band, historically and projected into the future, are shown for the BAU and efficiency scenarios in panels (iii) and (iv) respectively (half star increments not shown).
Maintenance
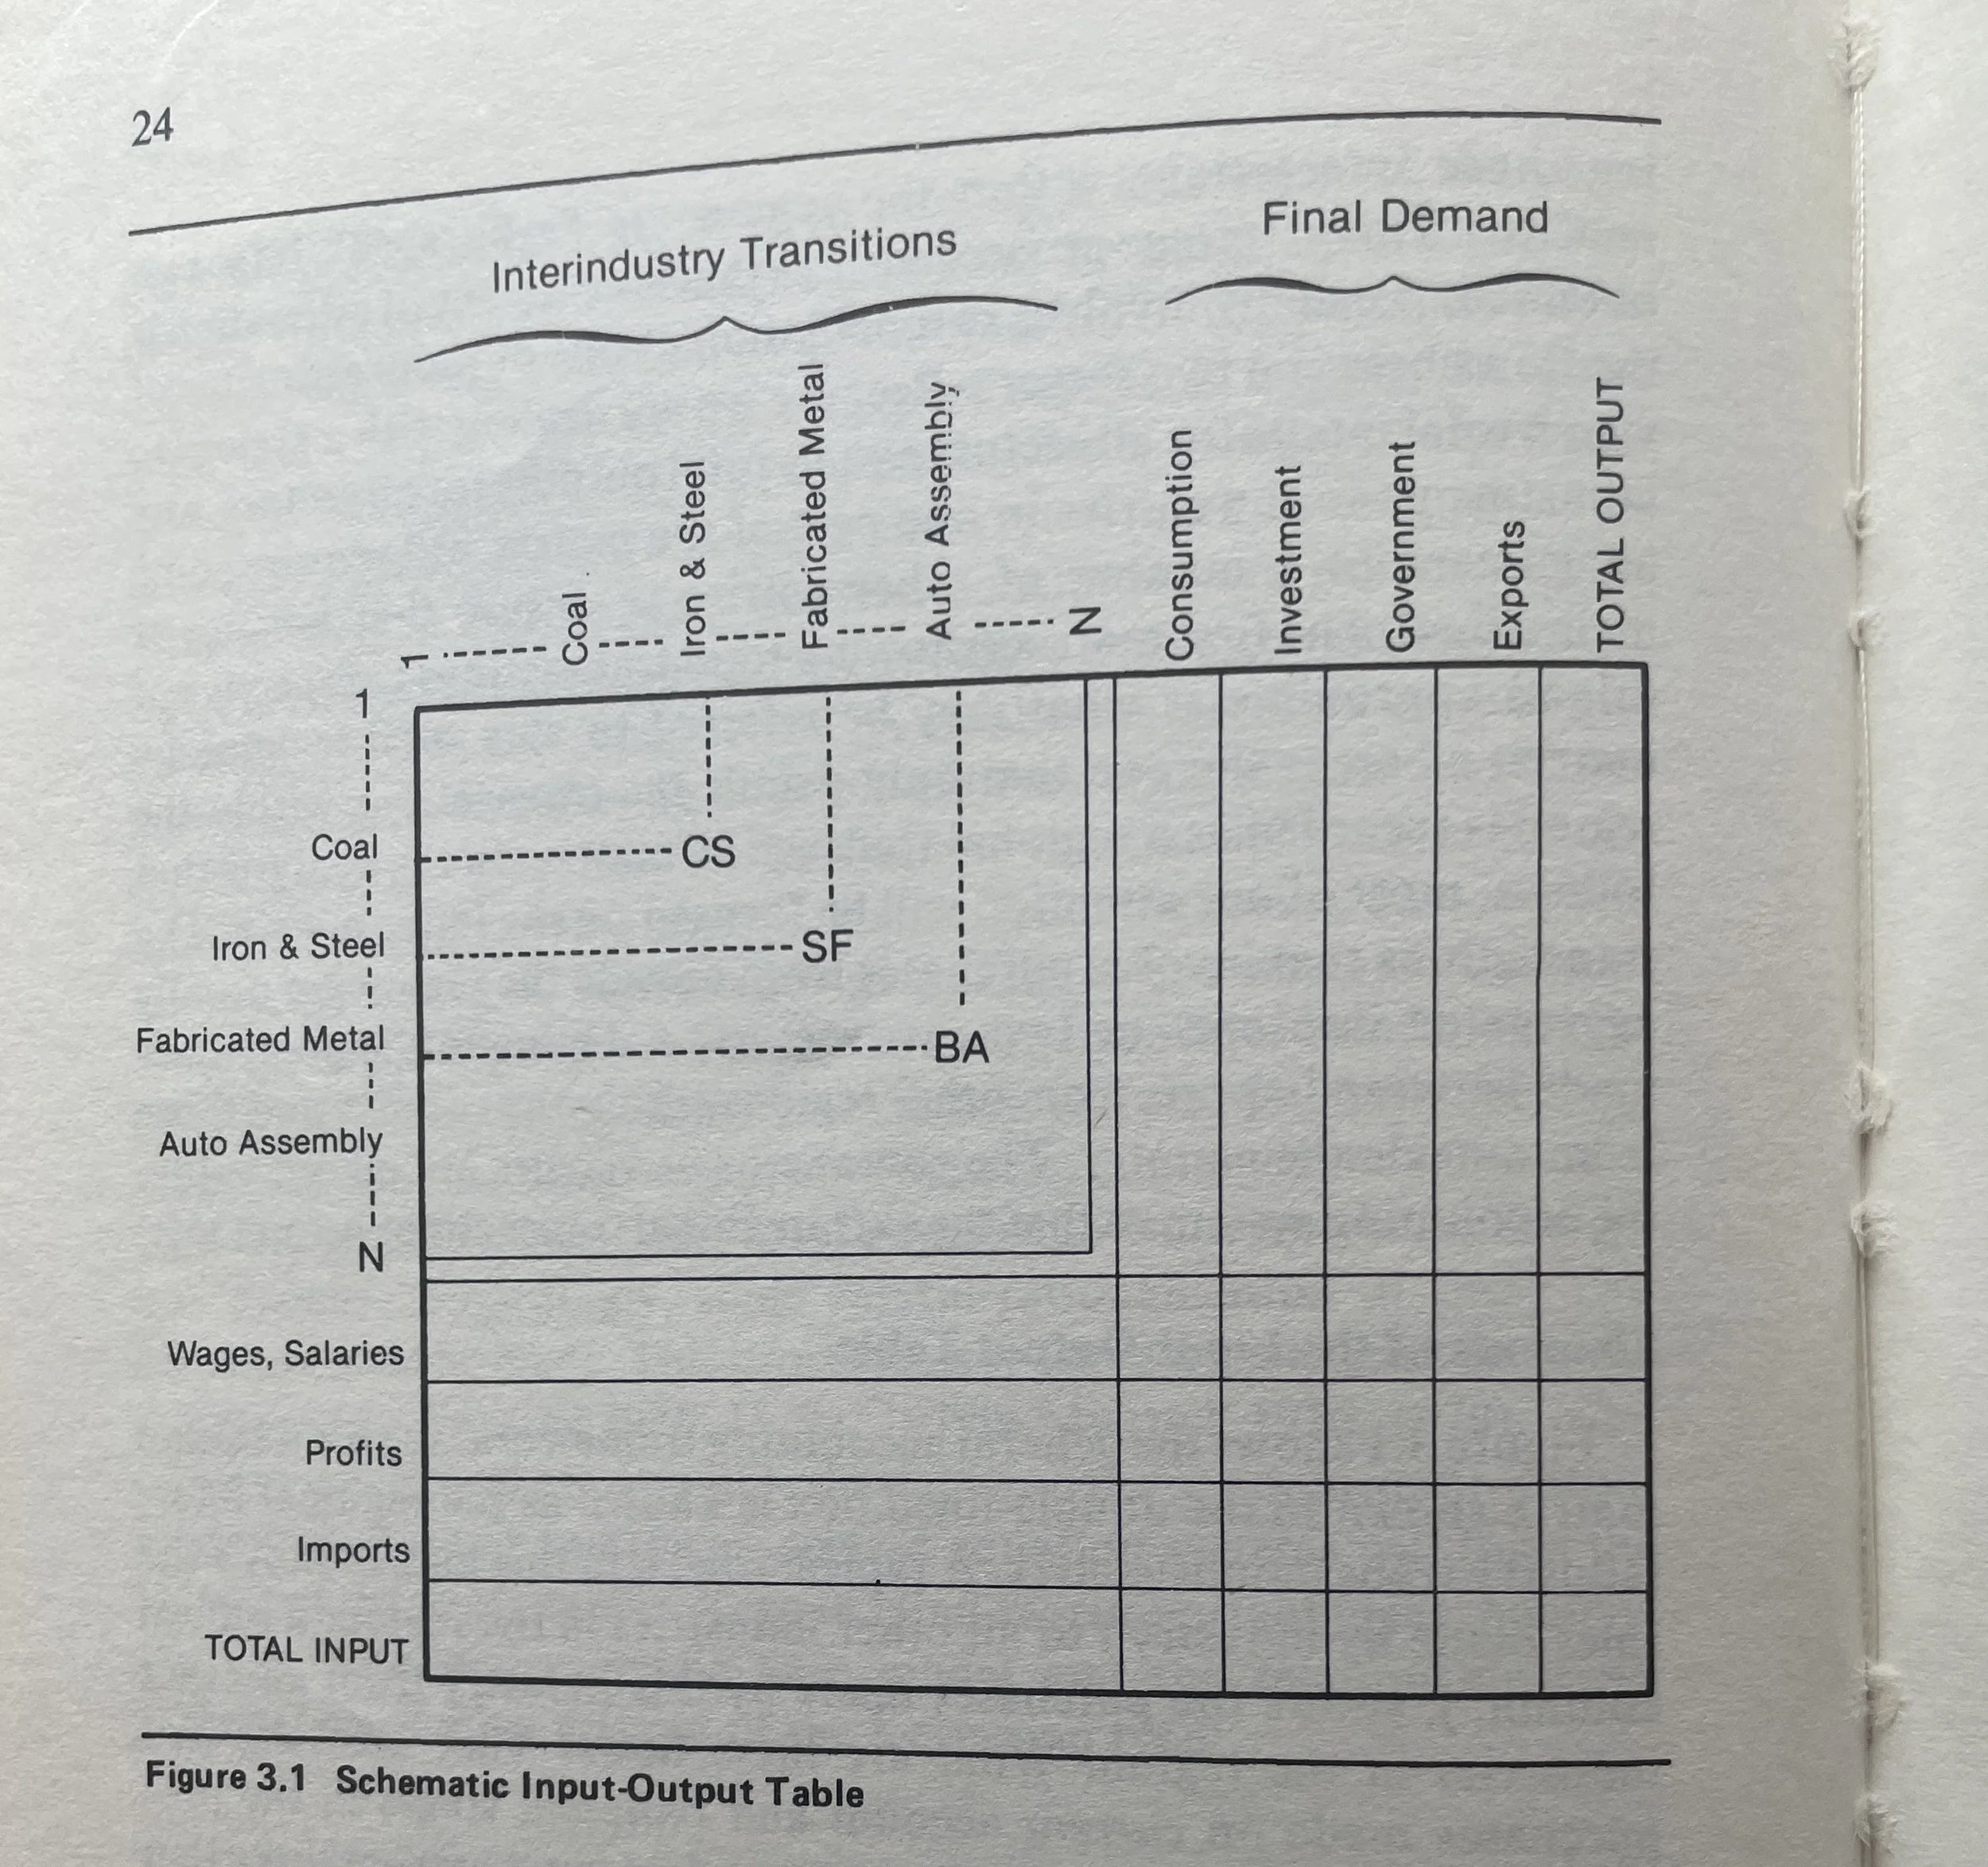
Imagine an economy: regional economic models
Recently I discovered this gem of a text book by Geoffrey Hewings on the bookshelf of our Lab. Published in 1985, the book provides an excellent introduction to IO as well as the more advanced regional IO topics. The illustrations may seem a little simplistic by today's standards, but I'm really digging the minimalism.
The opening paragraph:
“Imagine a national economy that has been divided into a set of regions. Within each region, grouped into sectors, there is a set of firms producing a variety of commodities that are consumed by other firms in the course of the production of other more finished commodities (e.g., automobile parts are assembled into a finished automobile), consumers, government, export markets, or other firms using these commodities as investment goods. In addition to engaging in sales activities, firms are also active in the purchase of commodities and other inputs—labor, entrepreneurial skills, as well as commodities purchased from outside the region. It would not be unusual to find in a region of several million people well over 100,000 firms producing as many as half a million or more commodities.”
From further into the introduction:
“With the large number of firms, commodities, consumers, and other actors in the regional economy, it should be obvious that tracing the impacts on a firm-by-firm or consumer-by-consumer basis would be a daunting proposition. Clearly, we need some accounting system into which these interactions can be placed in the hope that some analytical method could be employed to trace the impacts in a systematic fashion. In a sense, we are going to have to sacrifice the richness of the reality of the regional economy for some reduced-form picture or model that is tractable and, we hope, representative as far as possible of the micro level interactions. As happens with a great deal of analytical work in the social sciences, the gains of model development are not without cost; as we shall see, this is the case in the development of a family of analytical tools that are referred to as social accounting systems. Regional input-output analysis is one subset of these accounting systems.”
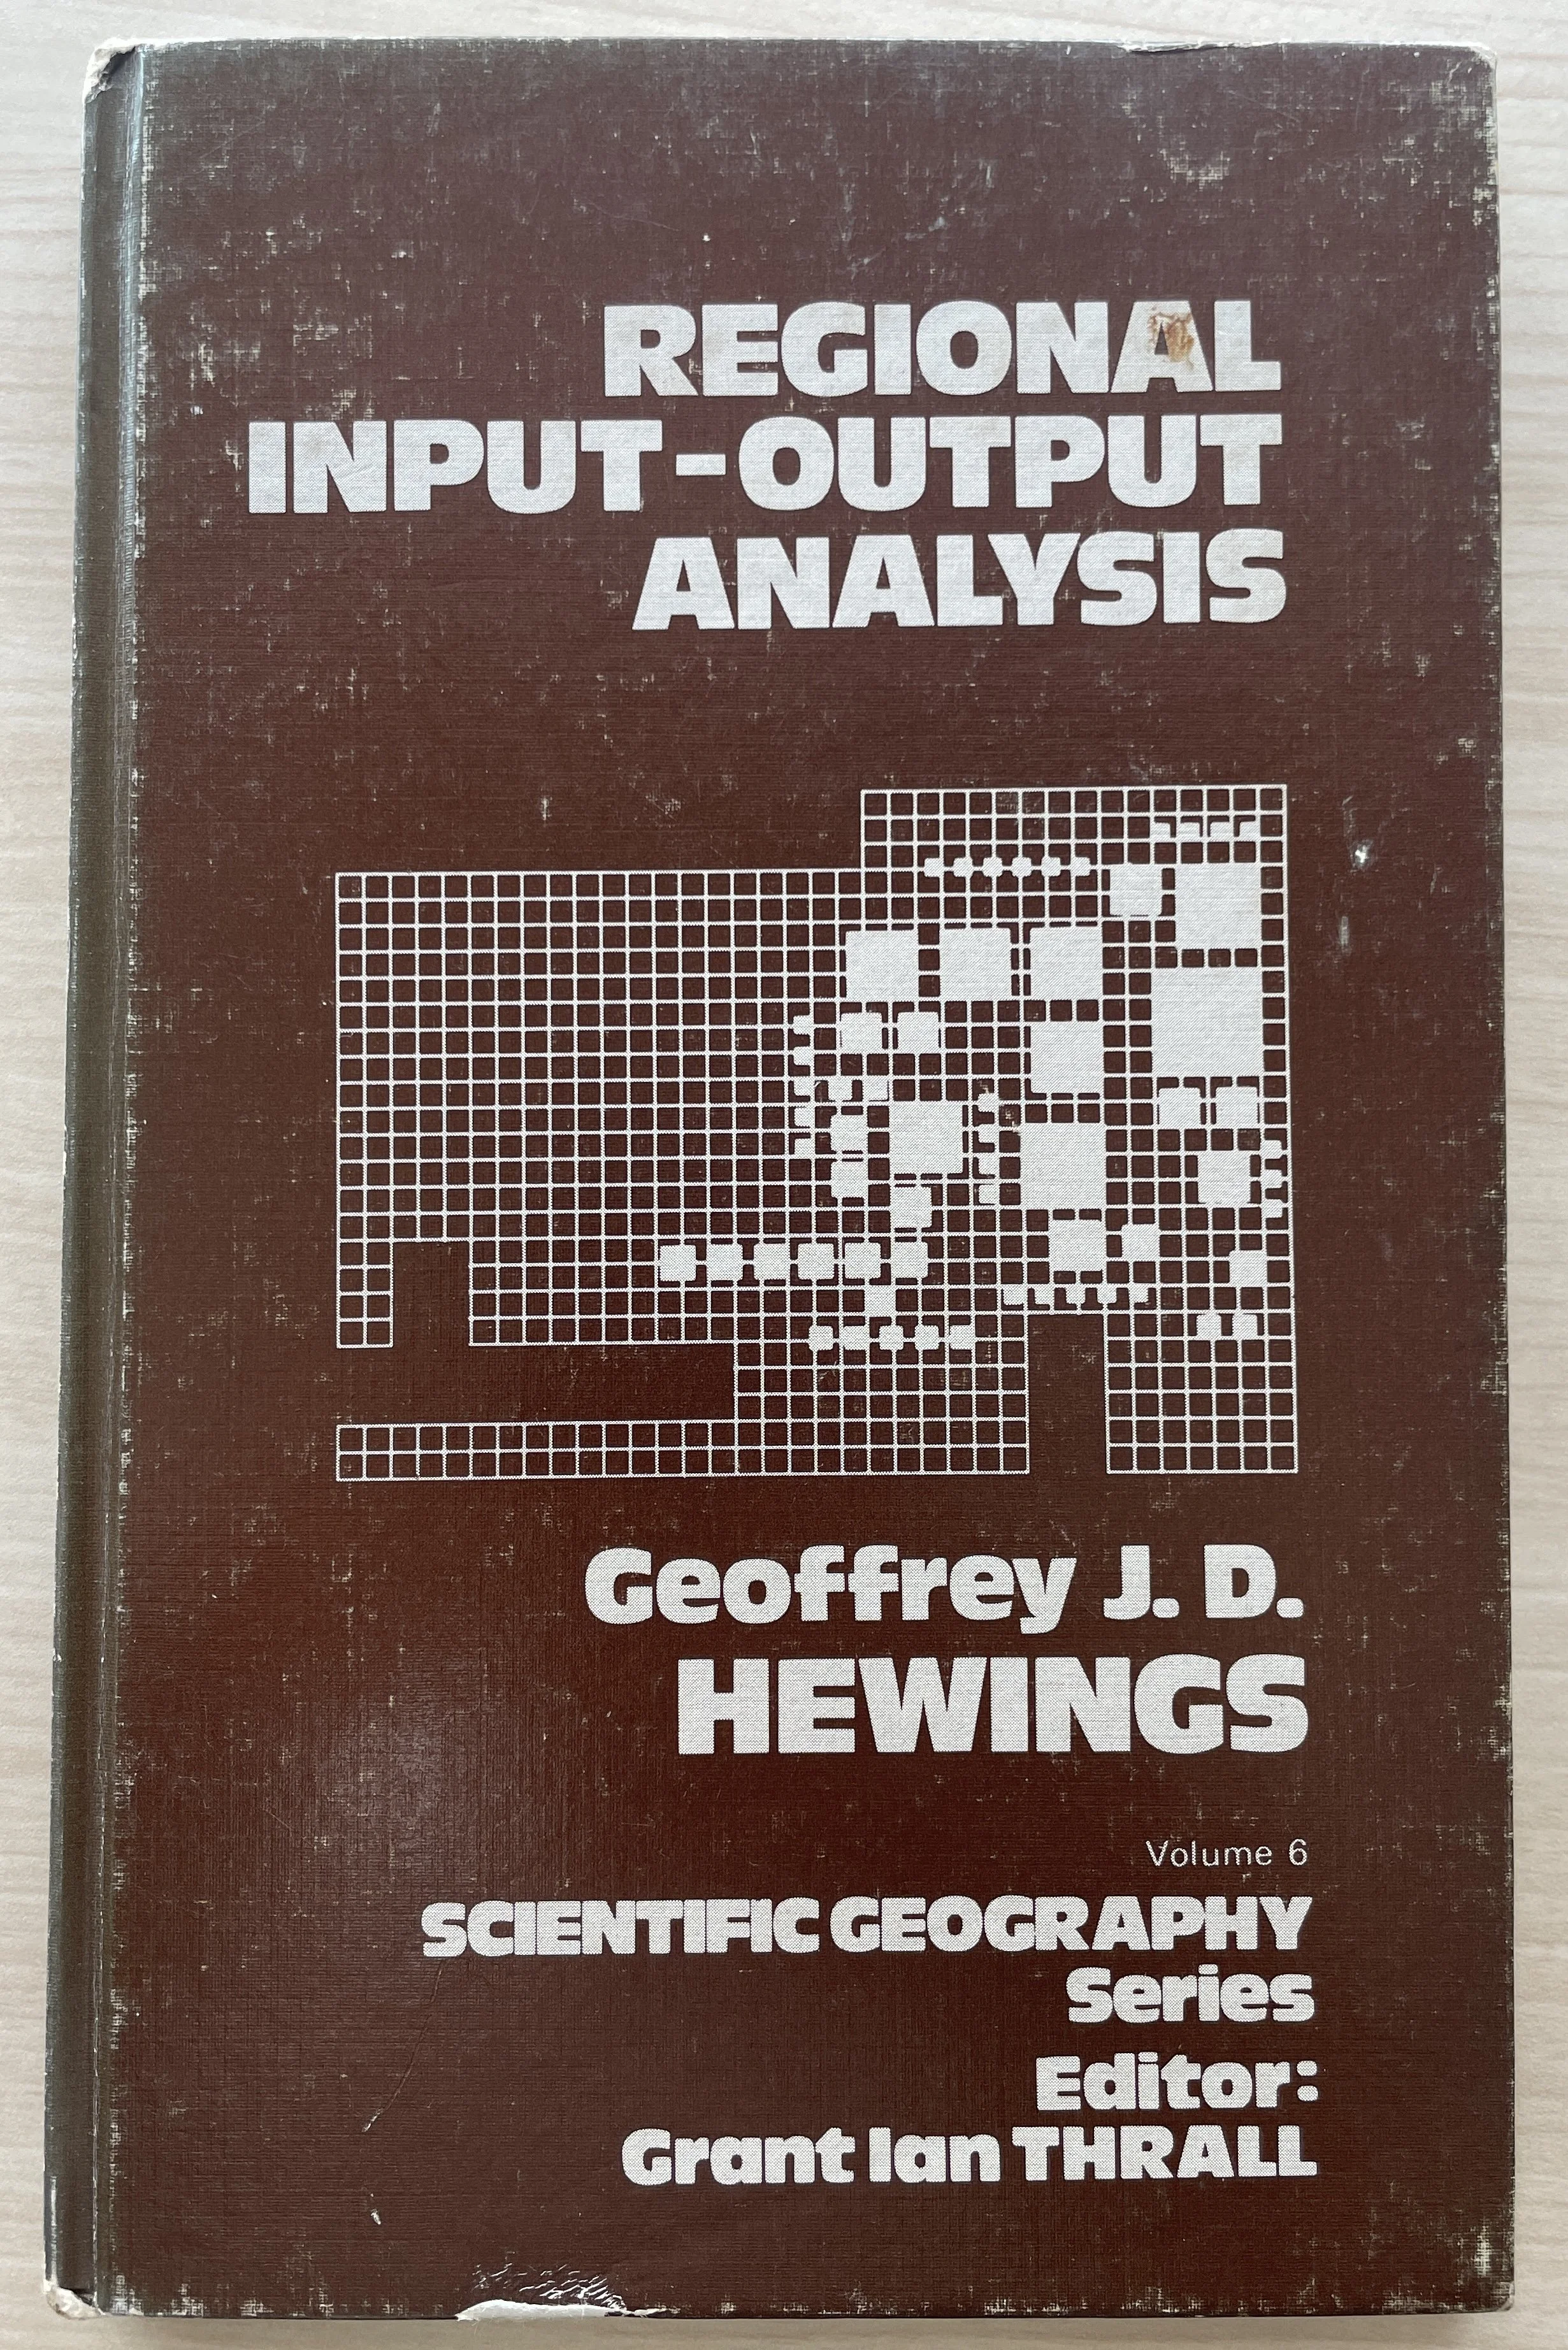
Hewings, G., 1985, Regional Input-Output Analysis, Scientific Geography Series, SAGE Publications, ISBN: 9780803927407
Vehicle recycling
Recently, I had the opportunity to visit a passenger vehicle dismantler and recycler here in Japan. This facility was interesting because of the range of activities conducted at the site, as well as the care taken in material recovery.
This facility dismantles vehicles non-destructively, which maximises the number of parts that can be reused. This careful dismantling requires more time and skilled labour than other approaches, but results in more intact parts that can be reused. At another recycling facility, I have seen whole engine blocks removed using an excavator with a pincer attachment, which is fast though causes significant damage.
The vehicle parts recovered at this facility are exported to foreign markets. For these parts to retain value on the used parts market, there must be some demand from the vehicle stock in the destination country, and parts need to be in good-condition. It was obvious some work would be required to sort, clean and test the tangle of parts before reuse would be possible.
Parts that cannot be reused are transferred to other facilities for further processing, for example electric wiring harnesses are shipped for shredding and crushing to recover the bare copper insider.
This facility also has the capability to melt and recast scrap iron into basic parts. While these recast are relatively simple products, this allows the facility to perform provide value-added services. Care must be taken to avoid contaminating the melt with other materials and metal alloys.
For a further discussion about relationship to materials in our society see https://www.quoll.co/blog/repairing-our-material-relationships.
Global freight transport emissions
The transportation of freight by land, sea and air underpins the complex network of global trade in physical commodities. Greenhouse gas emissions from freight transportation are a significant component of global emissions and are predicted to grow in coming decades. However, the inclusion of freight transport in emissions accounts and environmental impact studies is often incomplete. Both data availability and difficulties in allocating freight emissions to specific commodity trades contributes to this. In this study, international freight movements by transport mode are estimated from the bottom-up by imputing global freight transport routes. Emissions are estimated from these freight movements and integrated with a global multiregional input−output model. This enables the calculation of carbon footprints that are complete with respect to freight emissions. We estimate that global freight transport emissions contributed 2.8 Gt CO2-equiv in 2012, or about 41% of total transport emissions. In general, freight footprints contribute about 9% to national emissions footprints. While trade in physical commodities (such as construction materials, food and fossil fuels) are associated with the largest embodied freight emissions, services (such as public administration, education and health) also require significant freight transport. Using a consumption-based allocation of freight transport emissions allows the decarbonisation of other sectors to be complementary to the decarbonisation of transport through reduction in demand, for example through material efficiency strategies. To drive decarbonisation in maritime transport it is critical to include bunker emissions in national emissions inventories, thereby completing the system boundary.
Commodities with the largest contribution to the freight emissions footprint are construction (15%), food and beverages (12%), electrical products and machinery (10%) and petroleum, chemical and nonmetallic mineral products (9%) and agriculture (6%). The provision of construction services is associated with the largest embodied freight emissions. This is intuitive since construction supply chains require the transportation of heavy bulk commodities such as sand, gravel and timber. Furthermore, construction requires transformed materials that also require bulk transport in their supply chains, for example steel, concrete and masonry products. While petroleum, chemical and non- metallic mineral products contribute 9% to the total freight emissions footprint, the total embodied tonne-kilometres amount to 11% of the total. This can be explained through oil and other bulk commodities being transported by sea, with relatively low emissions intensity. Similarly, agriculture ranks higher in embodied freight emissions than embodied tonne- kilometres. This may reflect that agricultural supply chains are relatively simple, with products delivered to final consumption quickly after being produced. This contrasts with food and beverage products, which require more transformations and production steps, as well as freight transport. Education, health and public administration services are also associated with significant transport emissions. Despite being service sectors, these categories have complex material requirements which involve freight transport.
Previously, I discussed the construction of a global freight transport adjacency matrix here. This research was recently published here in the journal of Environmental Science & Technology.
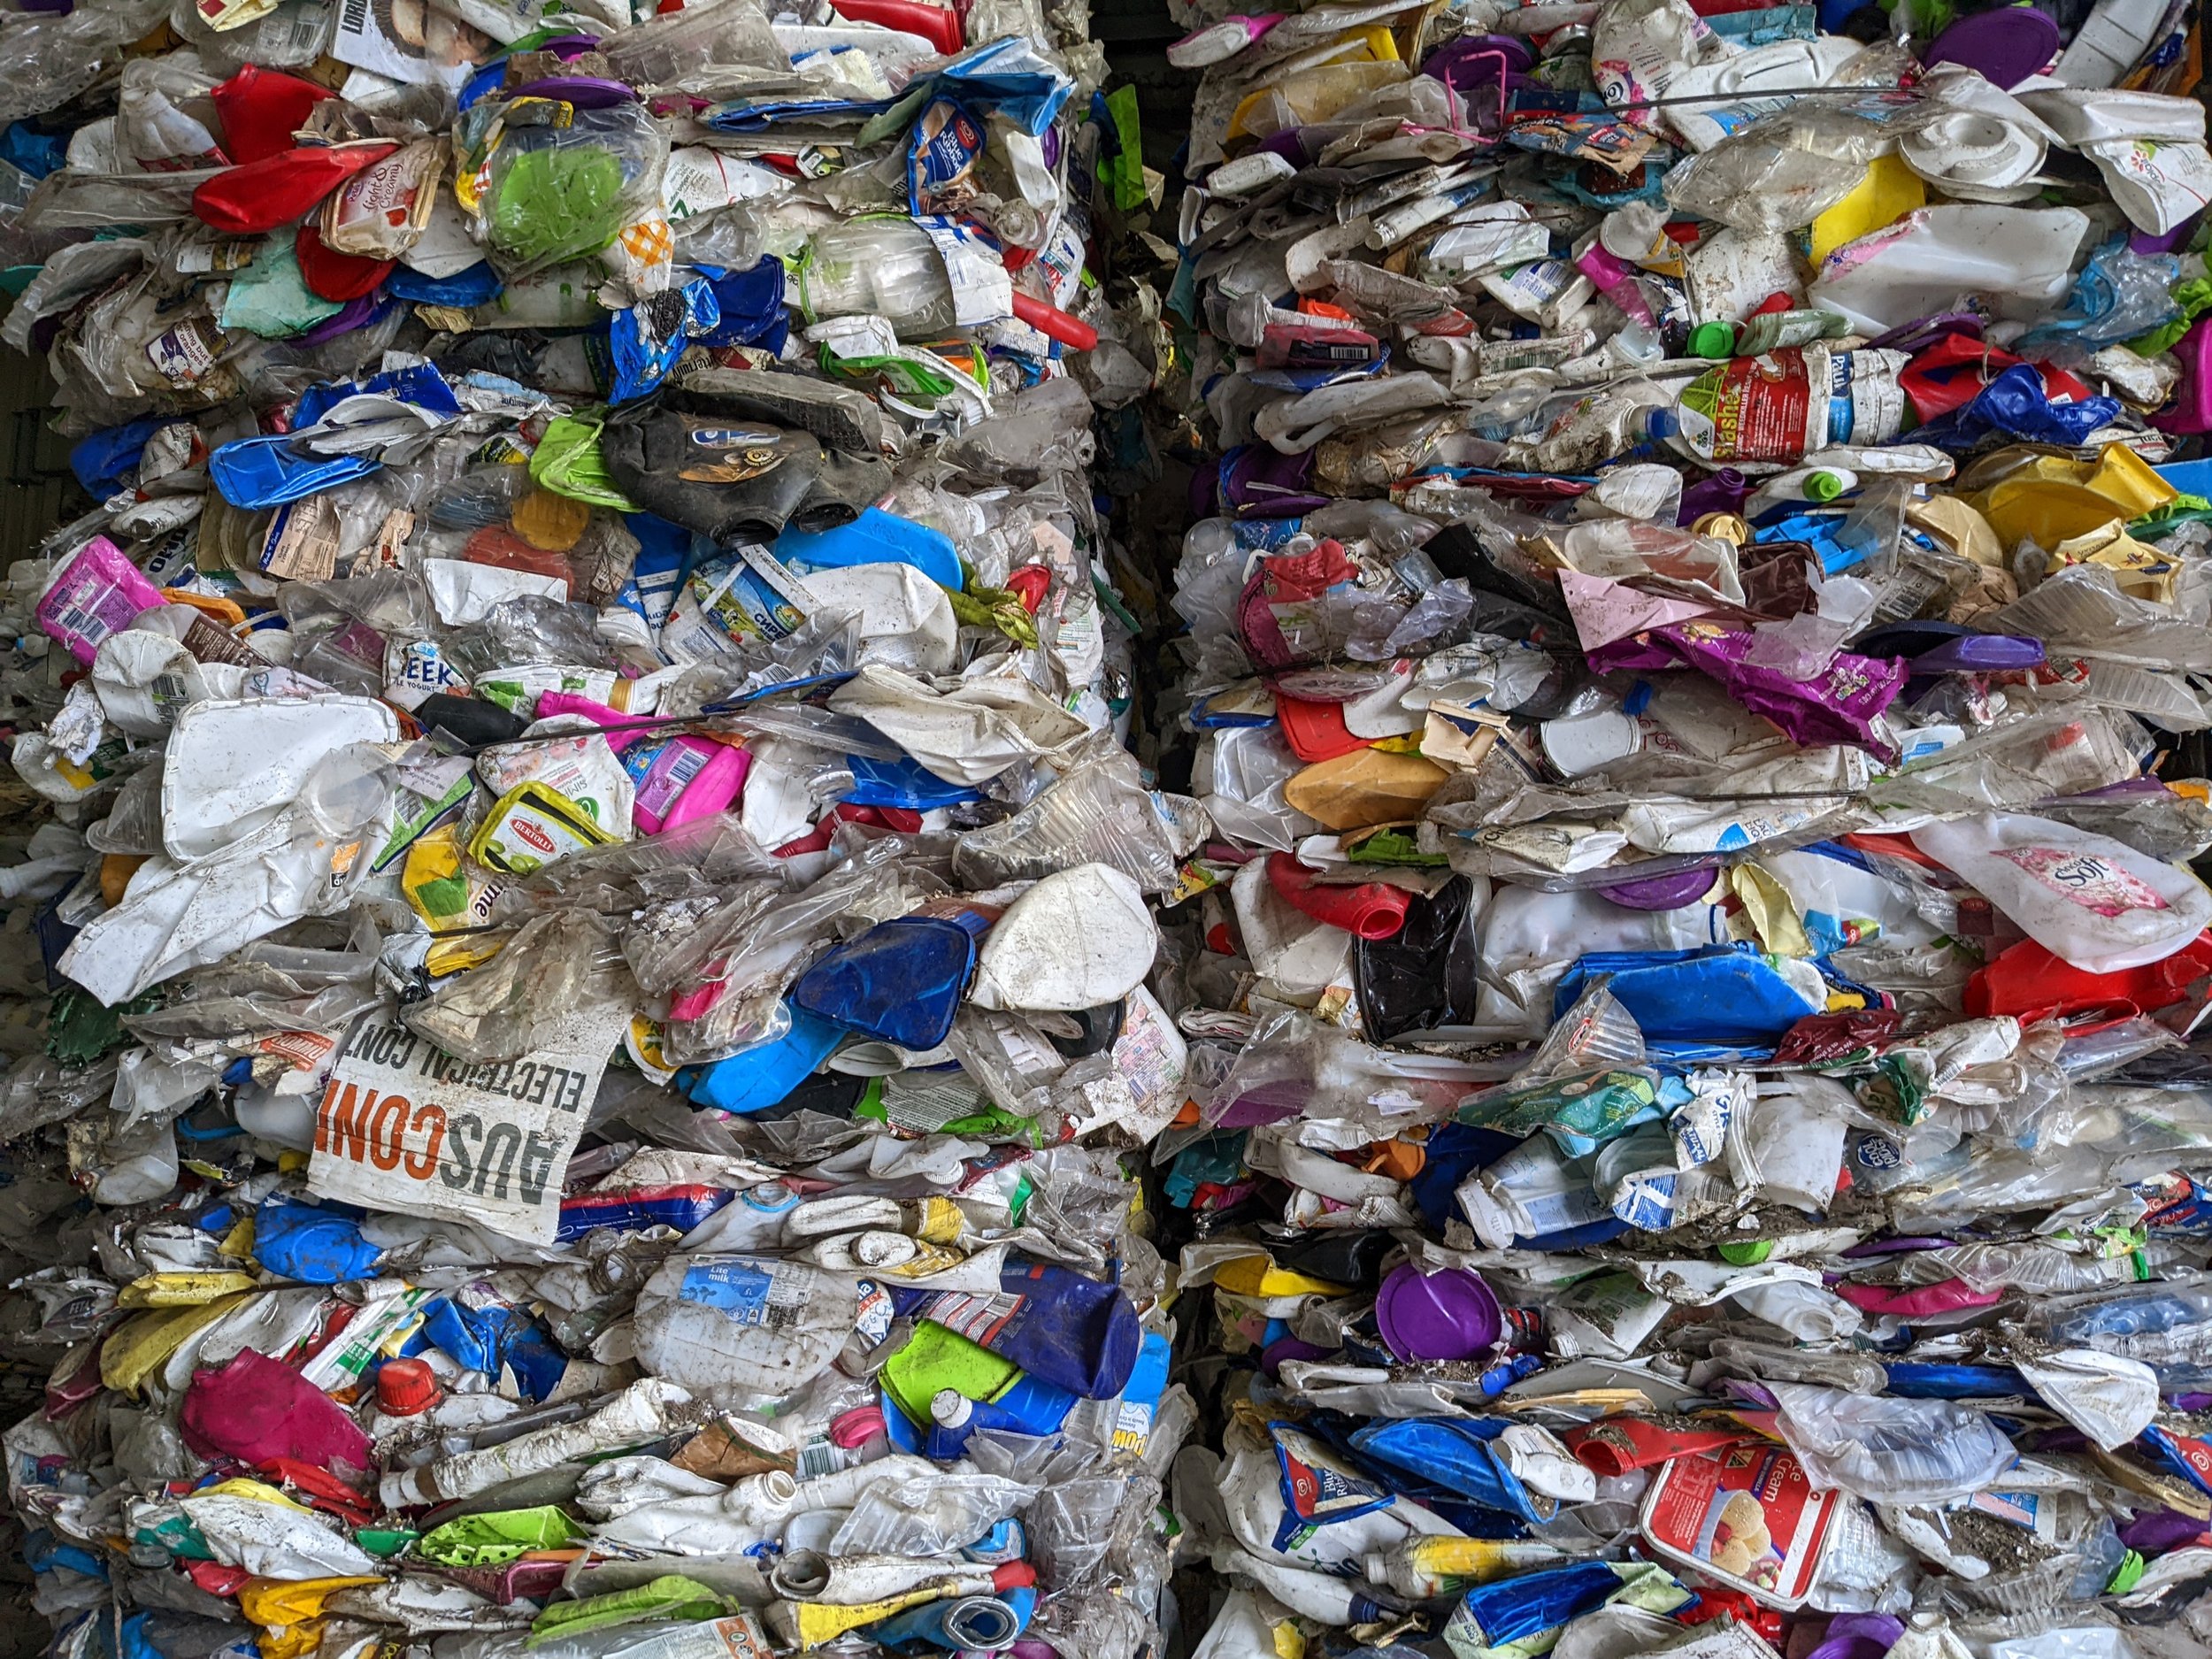
Australian waste plastics flows
Plastics waste is a significant issue in Australia, with plastics waste generation continuing to grow. Central to idea of a ‘circular economy’ is that waste materials flow back into production, to be remade into new products. However, in Australia these flows are not visible due to limitations in published datasets. In this study, we simulated waste flows from consumption, through waste treatment and back into new production. This approach reveals how both plastics waste and recycled plastics become embodied in final consumption. The analysis shows there is currently no evidence that plastics waste generation has decoupled from either population or GDP growth. In fact, the recycling rate has declined in relative terms, potentially caused by recycling infrastructure limitations and an overall decline in Australian manufacturing.
Plastics waste data was extracted from the National Waste Database [1], however this was reshaped to make it easier to use. The reshaped data can be downloaded here: https://zenodo.org/records/12059380.
It can be seen from the figure that recycling tonnage decreases relative to total waste generation, where the ratio is calculated as recycling/total waste generation (in tonnes). One cause of this is likely the processing recycling capacity limitation in Australia [2]. The National Plastics Plan and the Recycling Modernisation Fund aim to improve this situation through the expansion of recycling infrastructure [3].Also shown in the figure 5 the decline in manufacturing’s contribution to total GDP (manufacturing gross value added/GDP), an ongoing trend in Australia for the past few decades [4]. Unfortunately, the number of local plastic resin manufacturers has decreased in recent years, with only HDPE, LDPE and PP still produced in Australia [5]. Growing Australia’s manufacturing and remanufacturing sector is part of the federal government’s Modern Manufacturing Strategy [6]. The existence of local manufacturing industries who demand recycled materials can give an advantage to local recyclers and secondary producers, for example through lower relative transport costs.
One perspective of the circular economy is that of a network, where producers and consumers are in relationship with one another, along with other actors such as waste treatment and recycling service providers. Network analysis can be employed to investigate circular economy indicators, for example the strength of interconnections between different regions and the sparsity of recycling infrastructure distribution. Network analysis has been previously used to optimise the placement of waste treatment infrastructure and production facilities. Networks are also used to define social and business relationships between actors in the circular economy, for example waste producing firms who may exchange waste products or cooperate on new product designs. The network map below was constructed to show the relationships between LGAs, population centres and waste recycling services.
This research was recently published in Resources, Conservation and Recycling.
[1] https://www.dcceew.gov.au/environment/protection/waste/national-waste-reports/2022
[2] Harford, N. and French, J. (2022). Australian Recycling Infrastructure, Capacity and Readiness (Plastic and Paper). Australian Council of Recycling; Equilibrium. https://www.acor.org.au/uploads/2/1/5/4/21549240/220623_acor_infrastructure_readiness_report_june_2022_- _updated.pdf
[3] DAWE (2021). National Plastics Plan. Department of Agriculture, Water and the Environment, Canberra. https://www.agriculture.gov.au/sites/default/files/documents/national-plastics-plan-2021.pdf.
[4] Langcake, S. (2016). Conditions in the Manufacturing Sector. Reserve Bank of Australia. https://www.rba.gov.au/publications/bulletin/2016/jun/4.html.
[5] O’Farrell, K., Harney, F., and Stovell, L. (2022). Australian Plastics Flows and Fates Study 2020-21 – National Report. Department of Climate Change, Energy, the Environment and Water; Blue Environment Pty Ltd. https://www.dcceew.gov.au/environment/protection/waste/publications/australian-plastic-flows-and-fates-report-2020-21.
[6] Tomaras, J. (2020). Waste management and recycling in Budget Review 2020–21. Department of Parliamentary Services, Australian Parliament. https://parlinfo.aph.gov.au/parlInfo/download/library/prspub/7622081/upload_binary/7622081.pdf.
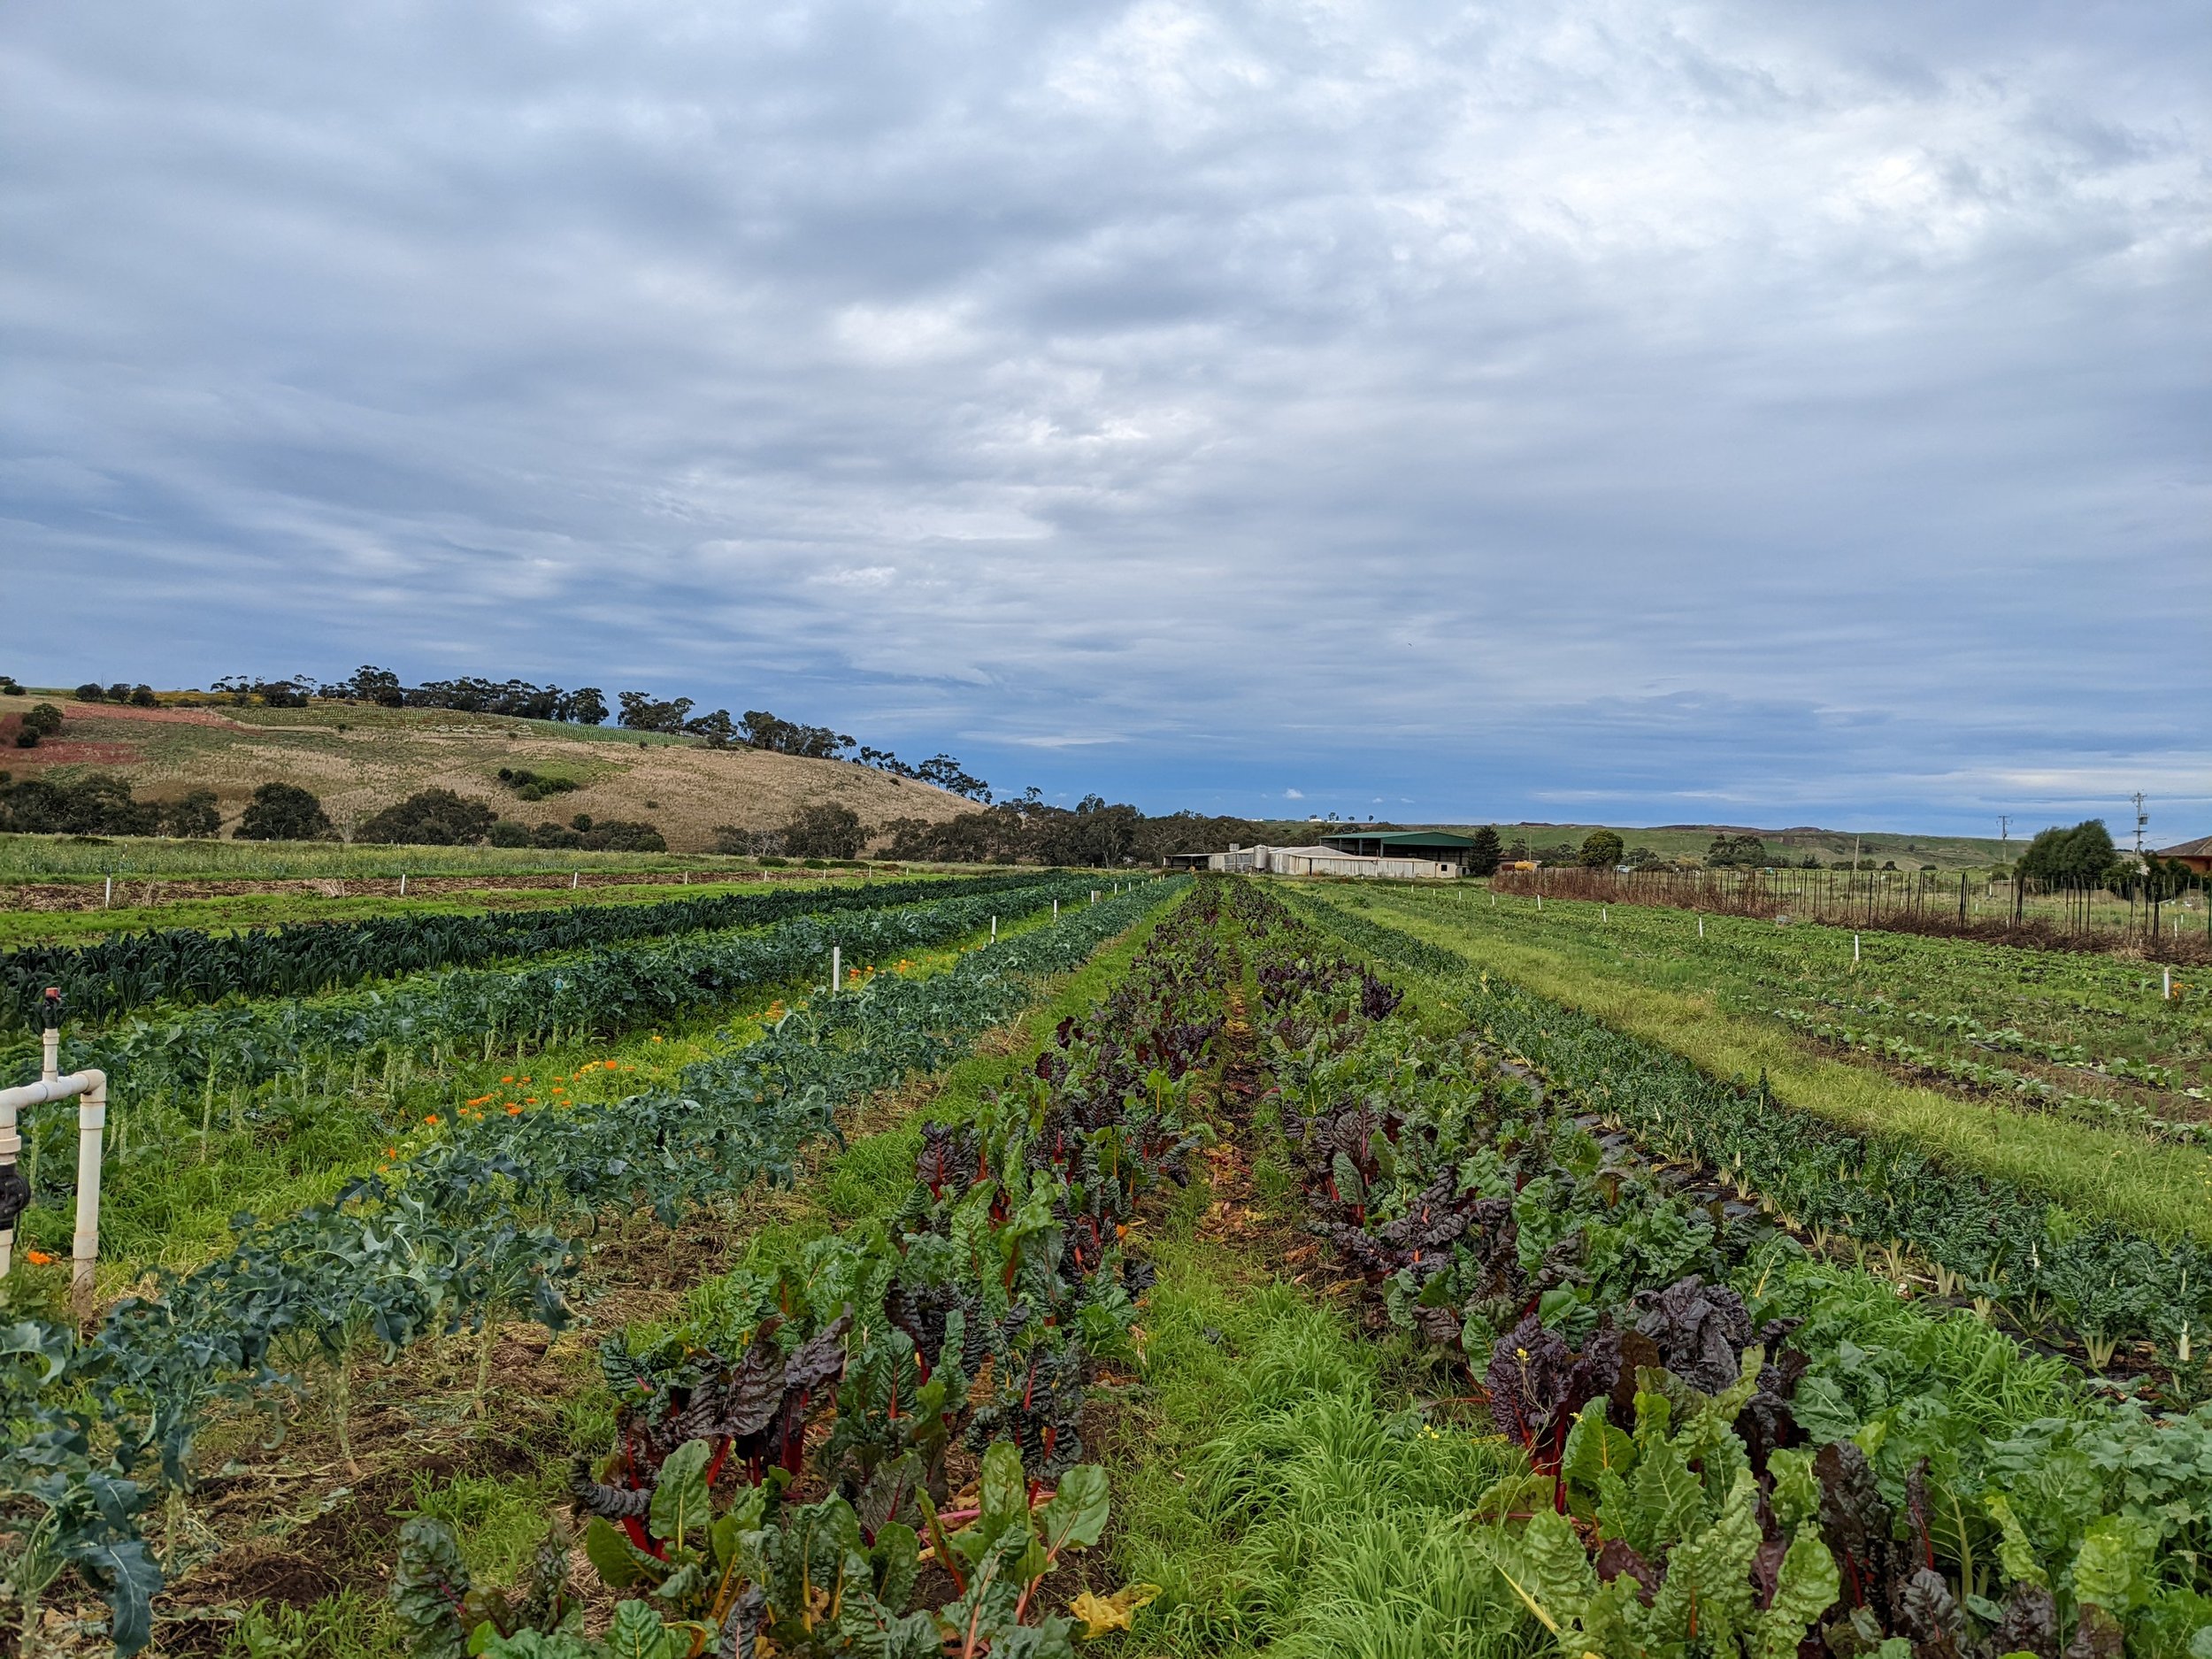
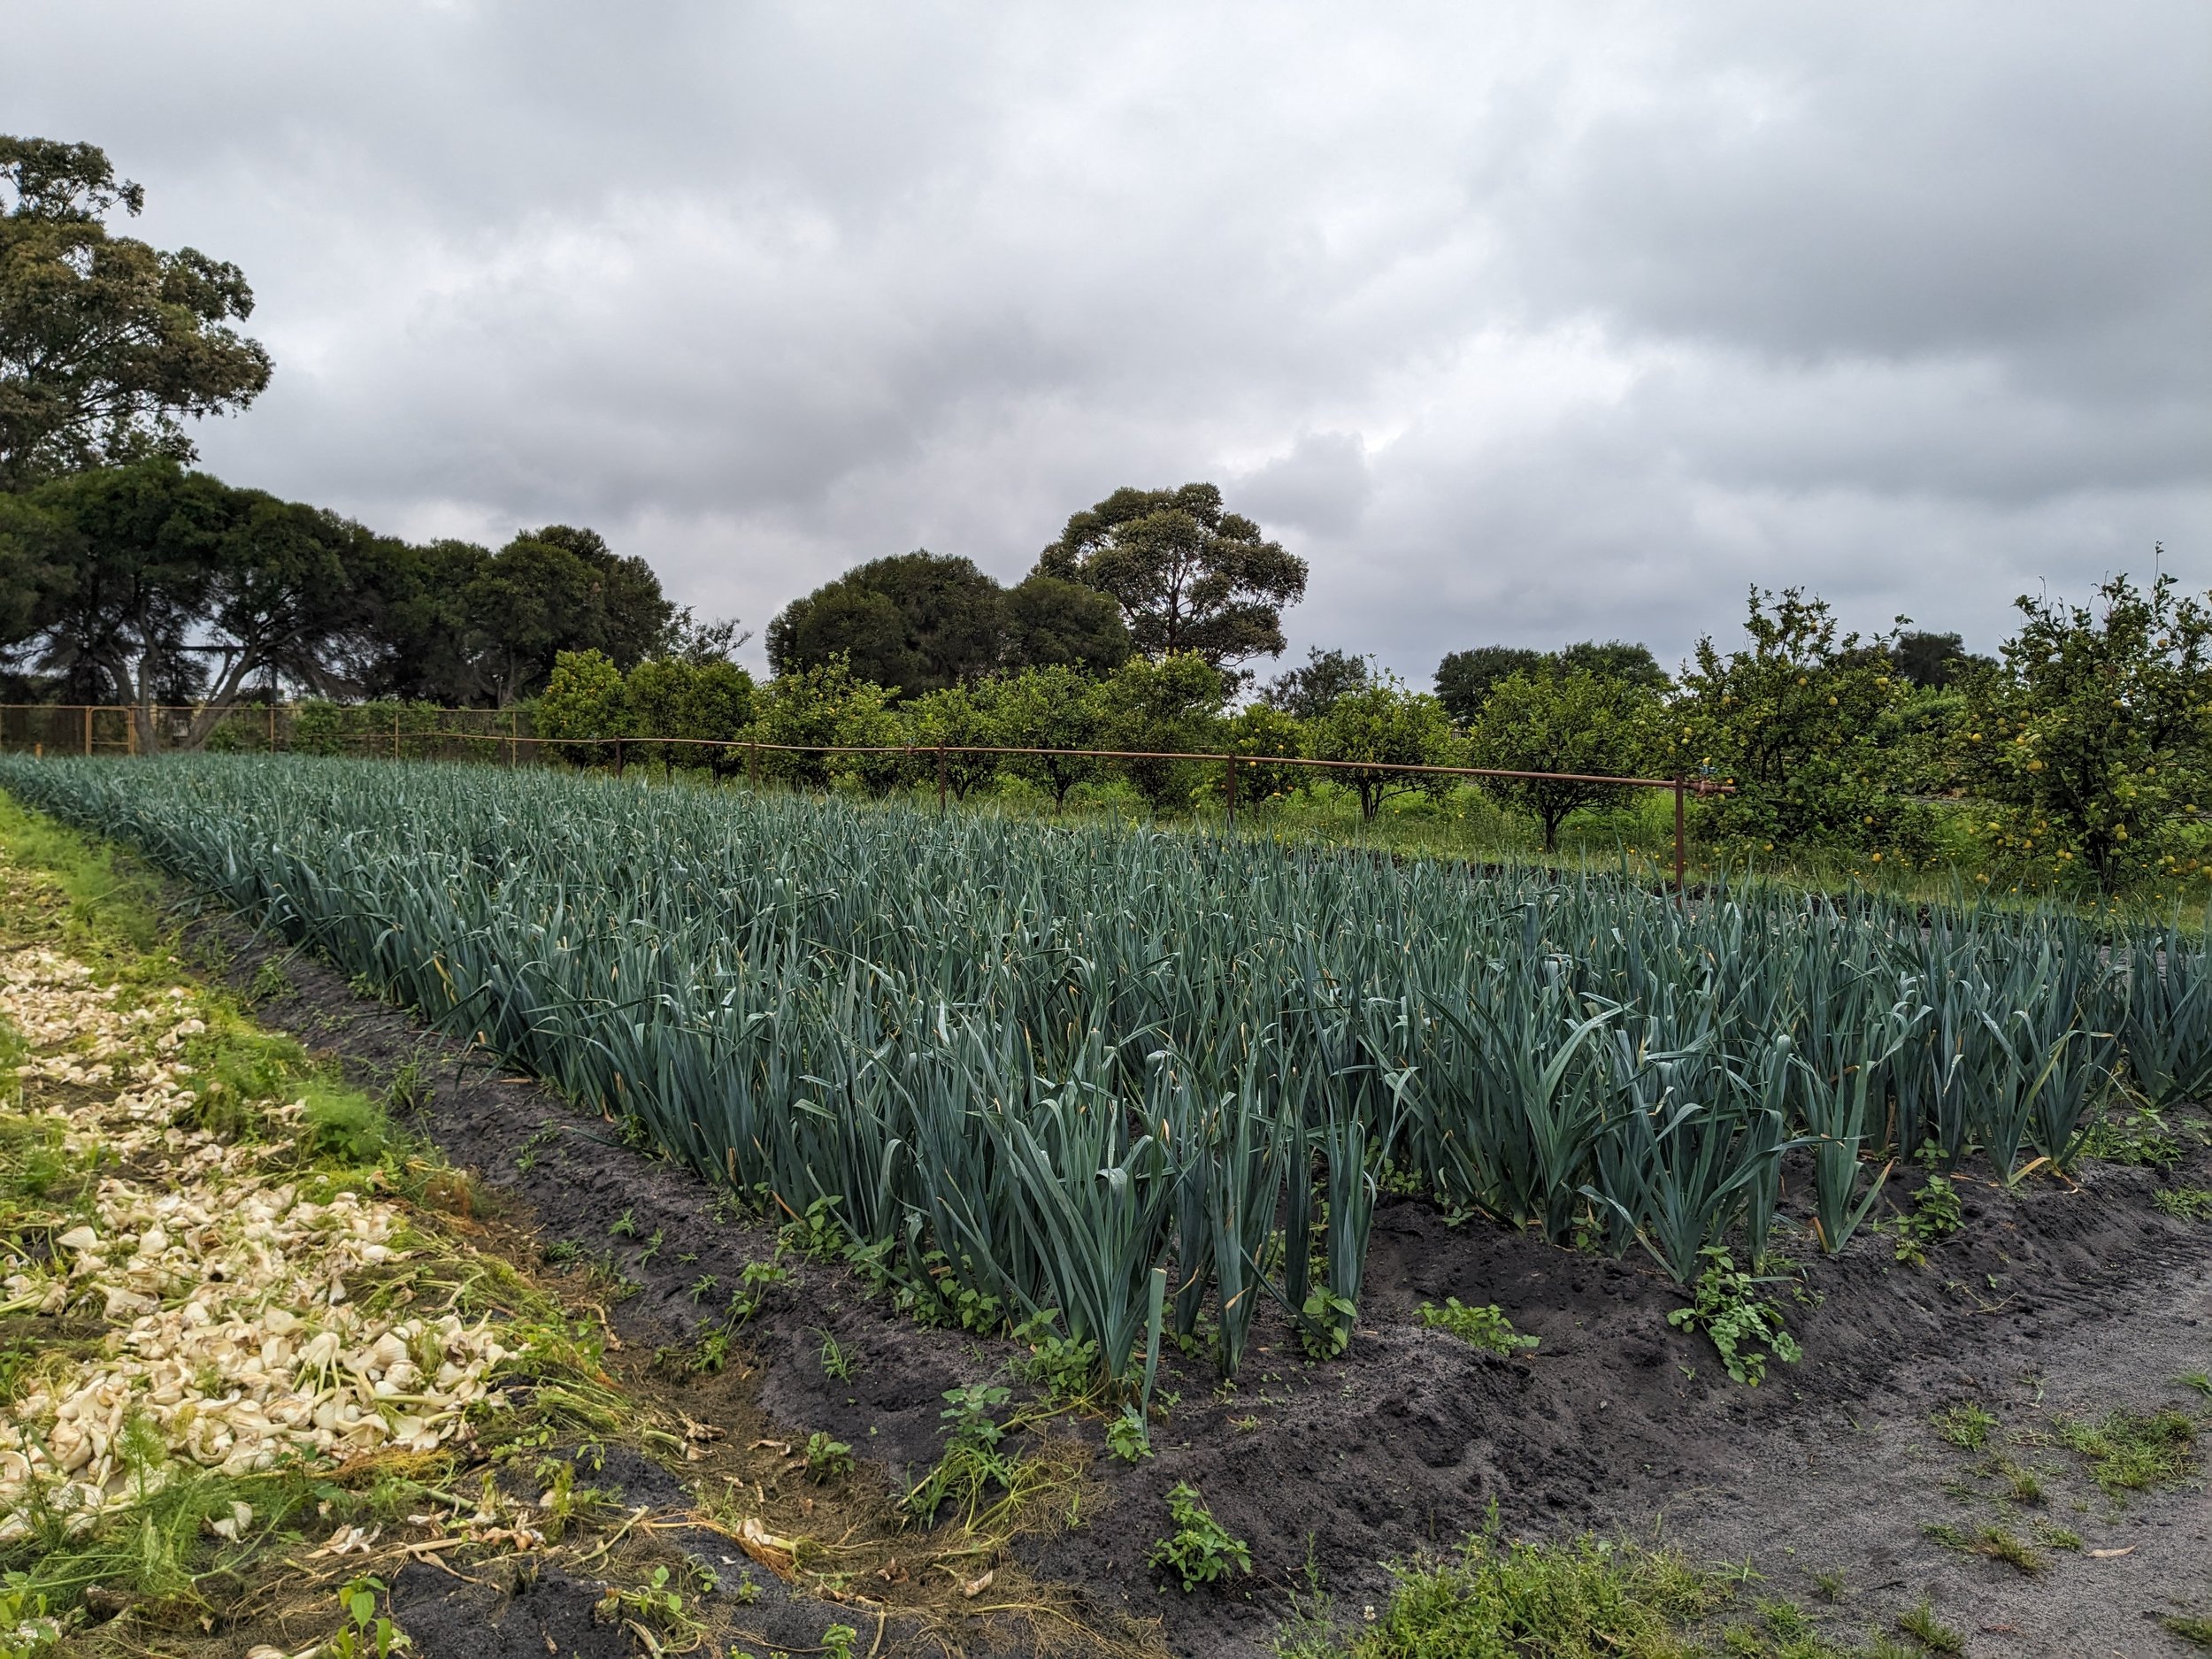
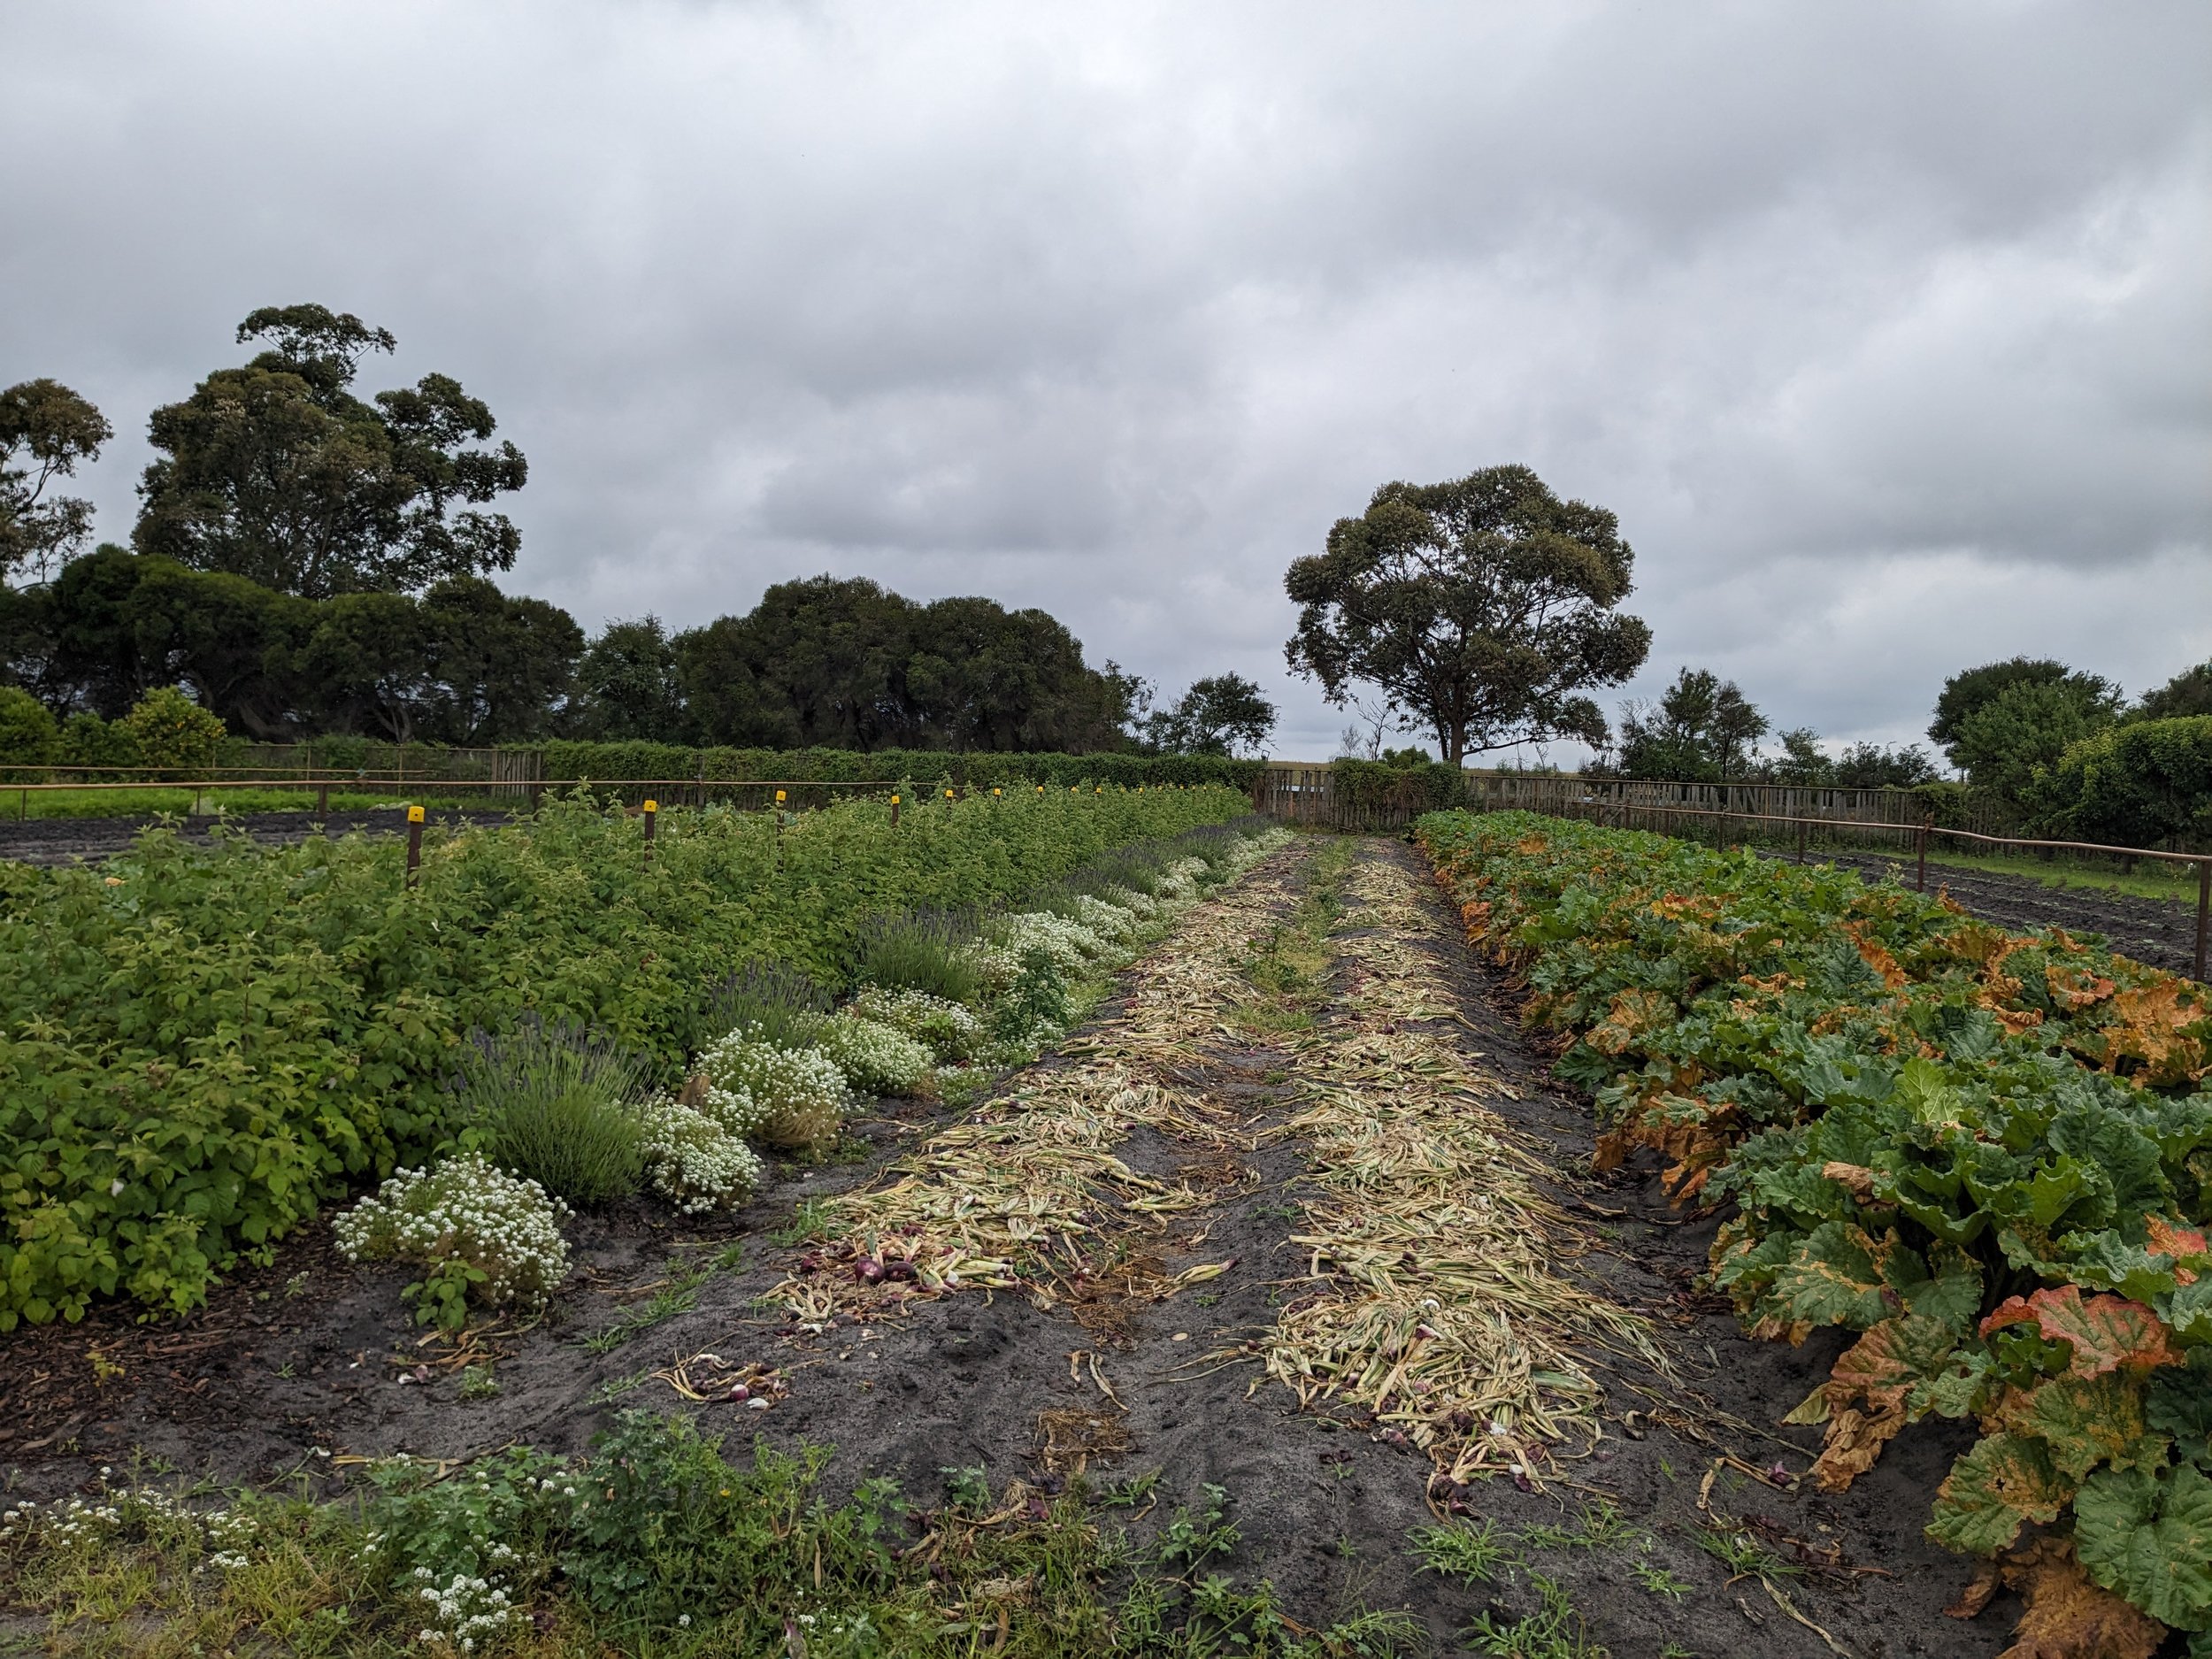
A day out at Baguely Farm

Primary industries of NZ
Sheep and wool growing at Farewell Spit
Sheep and wool growing at Farewell Spit
Mussel farming in the Pelorus Sound
Mussel farming in the Pelorus Sound
Mussel farming in the Pelorus Sound
Pine plantations on the shores of the Pelorus Sound
Pine plantations on the shores of the Pelorus Sound
Transparency, forced labour and sector heterogeneity

Under the Modern Slavery Act of 2018 [1] Australian businesses must report their exposure to modern slavery in their supply chains. However, discovering whether modern slavery exists in complex and global supply chains is difficult, even when businesses are well-motivated. Modern slavery can come in many forms. For example, debt bondage or bonded-labour, can trap workers in coercive situations until a debt is repaid. Workers may also be subjected to wage exploitation, where wages are severely underpaid [2]. Furthermore, the victims of human trafficking may be forced to work and have their passport or visa withheld.
Recently, attempts have been made to trace modern slavery in supply chains using input-output analysis [3,4]. Input-output analysis (IOA) is a powerful technique for tracing impacts along supply chains and has been used to successfully calculate carbon footprints. However, these supply chain analyses may be somewhat fraught when used to trace modern slavery.
By its’ nature, modern slavery is illicit and occurs in the shadows. This means that modern slavery data is scant, incomplete and often published with high uncertainty. Modern slavery auditors can conduct factory inspections to check for slavery-like conditions, however it’s not clear how results from specific factories can be used to make generalisation about whole sectors or industries. Other datasets and indicators are potentially correlated with modern slavery, for example skill, income, access to education and employment opportunities, access to trade unions and freedom to associate. Unfortunately, using inequality as an indicator risks painting all nations with high inequality, often in the global south, as complicit in modern slavery.
One assumption of IOA theory is that the firms within a sector are generally similar or homogeneous with respect to their direct intensity qj. That is, the direct intensity qj of an individual firm is similar to the group of firms comprising the sector. For the case of GHG impacts, we expect firms within a sector to have roughly comparable qj values since emissions generation is strongly influenced by technology and thermodynamic limits.
However for impacts that are sparsely distributed among firms, such as modern slavery, this assumption of sector homogeneity breaks down. Most firms will contribute zero to the sector's total impact, with perhaps only several firms contributing non-zero intensities. The implication of this is that the majority of the sector's output is not associated with modern slavery and the majority of the firms in the sector are not responsible for it. This makes it difficult to interpret footprint results implicating this sector in modern slavery.
The issue of sector heterogeneity can also be seen in the light of aggregation error. Aggregation error occurs when dissimilar firms are aggregated into the same sector within an IO model. With more information we could disaggregate the 'sparse polluters' from the rest of the sector. In fact, statistical offices and IOT compilers will create new sectors when technology and production recipes vary greatly within existing sectors, for example splitting coal-fired and hydroelectric from all electricity generation. However there is not enough information to perform this disaggregation in the case of modern slavery.
Despite these challenges, there are still tools available to improve supply chain transparency. For example, the freight and logistics industries have developed a number of technologies [5] to improve transparency in cold-chain logistics to prevent food wastage, reduce supply chain disruptions and to provide proof of cold-chain breaches. Unfortunately freight transport can also be a conduit for human trafficking and facilitate modern slavery. Transparency of container access can help mitigate this risk, as well as other issues such as product loss through pilfering. Another aspect to transparency is who reaps the rewards of our consumption. In some cases the lower order production layers, such as retailing, can gobble up a large fraction of total product cost and the workers at higher production layers remain lowly paid [6].
[1] Modern Slavery Act: https://www.legislation.gov.au/Details/C2018A00153
[2] https://www.governmentnews.com.au/migrants-trapped-in-slave-like-conditions-at-aussie-farms/
[3] Shilling et al., 2021, Modern slavery footprints in global supply chains, Journal of Industrial Ecology
[5] Such as: https://opensc.org/, https://www.cargoai.co/, https://www.enkibox.com.au/
Lake Mungo


Supply chain abstraction and reality
An abstraction layer is a thinking tool that enables us to temporarily ignore some parts of a problem. Thinking in terms of abstraction layers allows an engineer or scientist or any problem solver to focus on a specific aspect of a problem, as the wider environment and associated complexity is temporarily ignored. The language of abstraction layers is common in software engineering and computer science, where many libraries, frameworks and protocols sit atop one another [1].
One example of an abstraction is buying our food from the supermarket. All of the underlying physical reality and complexity of growing food, keeping it fresh and transporting it from the farm to market is more-or-less abstracted away from the consumer. However at some point, these abstractions begin to break down or to “leak”, in fact it has been posited that all abstractions end up leaking to some degree [2]. The supermarket abstraction begins to leak, for example, when a global pandemic hits food supply chains and consumers find the supermarket shelves empty. When this happens the consumer is forced to consider; where does all this food come from anyway, and should I grow my own food? The leak in the abstraction has laid reality bare.
The science of sustainability often involves attempts to reveal the physical reality that has been obscured by abstraction. Here the abstraction is created by our industrialised and consumerist society, whereby the consumer is disconnected from the manufacture of goods and services, and the entailing environmental degradation [3]. This disconnection comes about due to the complex and interconnected nature of global production and trade, as well as the pattern of shifting or ‘externalising’ pollution to other countries or regions – where the impacts are out of sight [4].
There are modelling techniques available that can unravel the complex web of inputs and impacts along global supply chains [5]. These techniques attempt to account for all the processes that contribute to the goods and services we consume. This allows environmental impacts to be traced to specific consumption activities, despite the impacts and consumption events being separated in time and space.
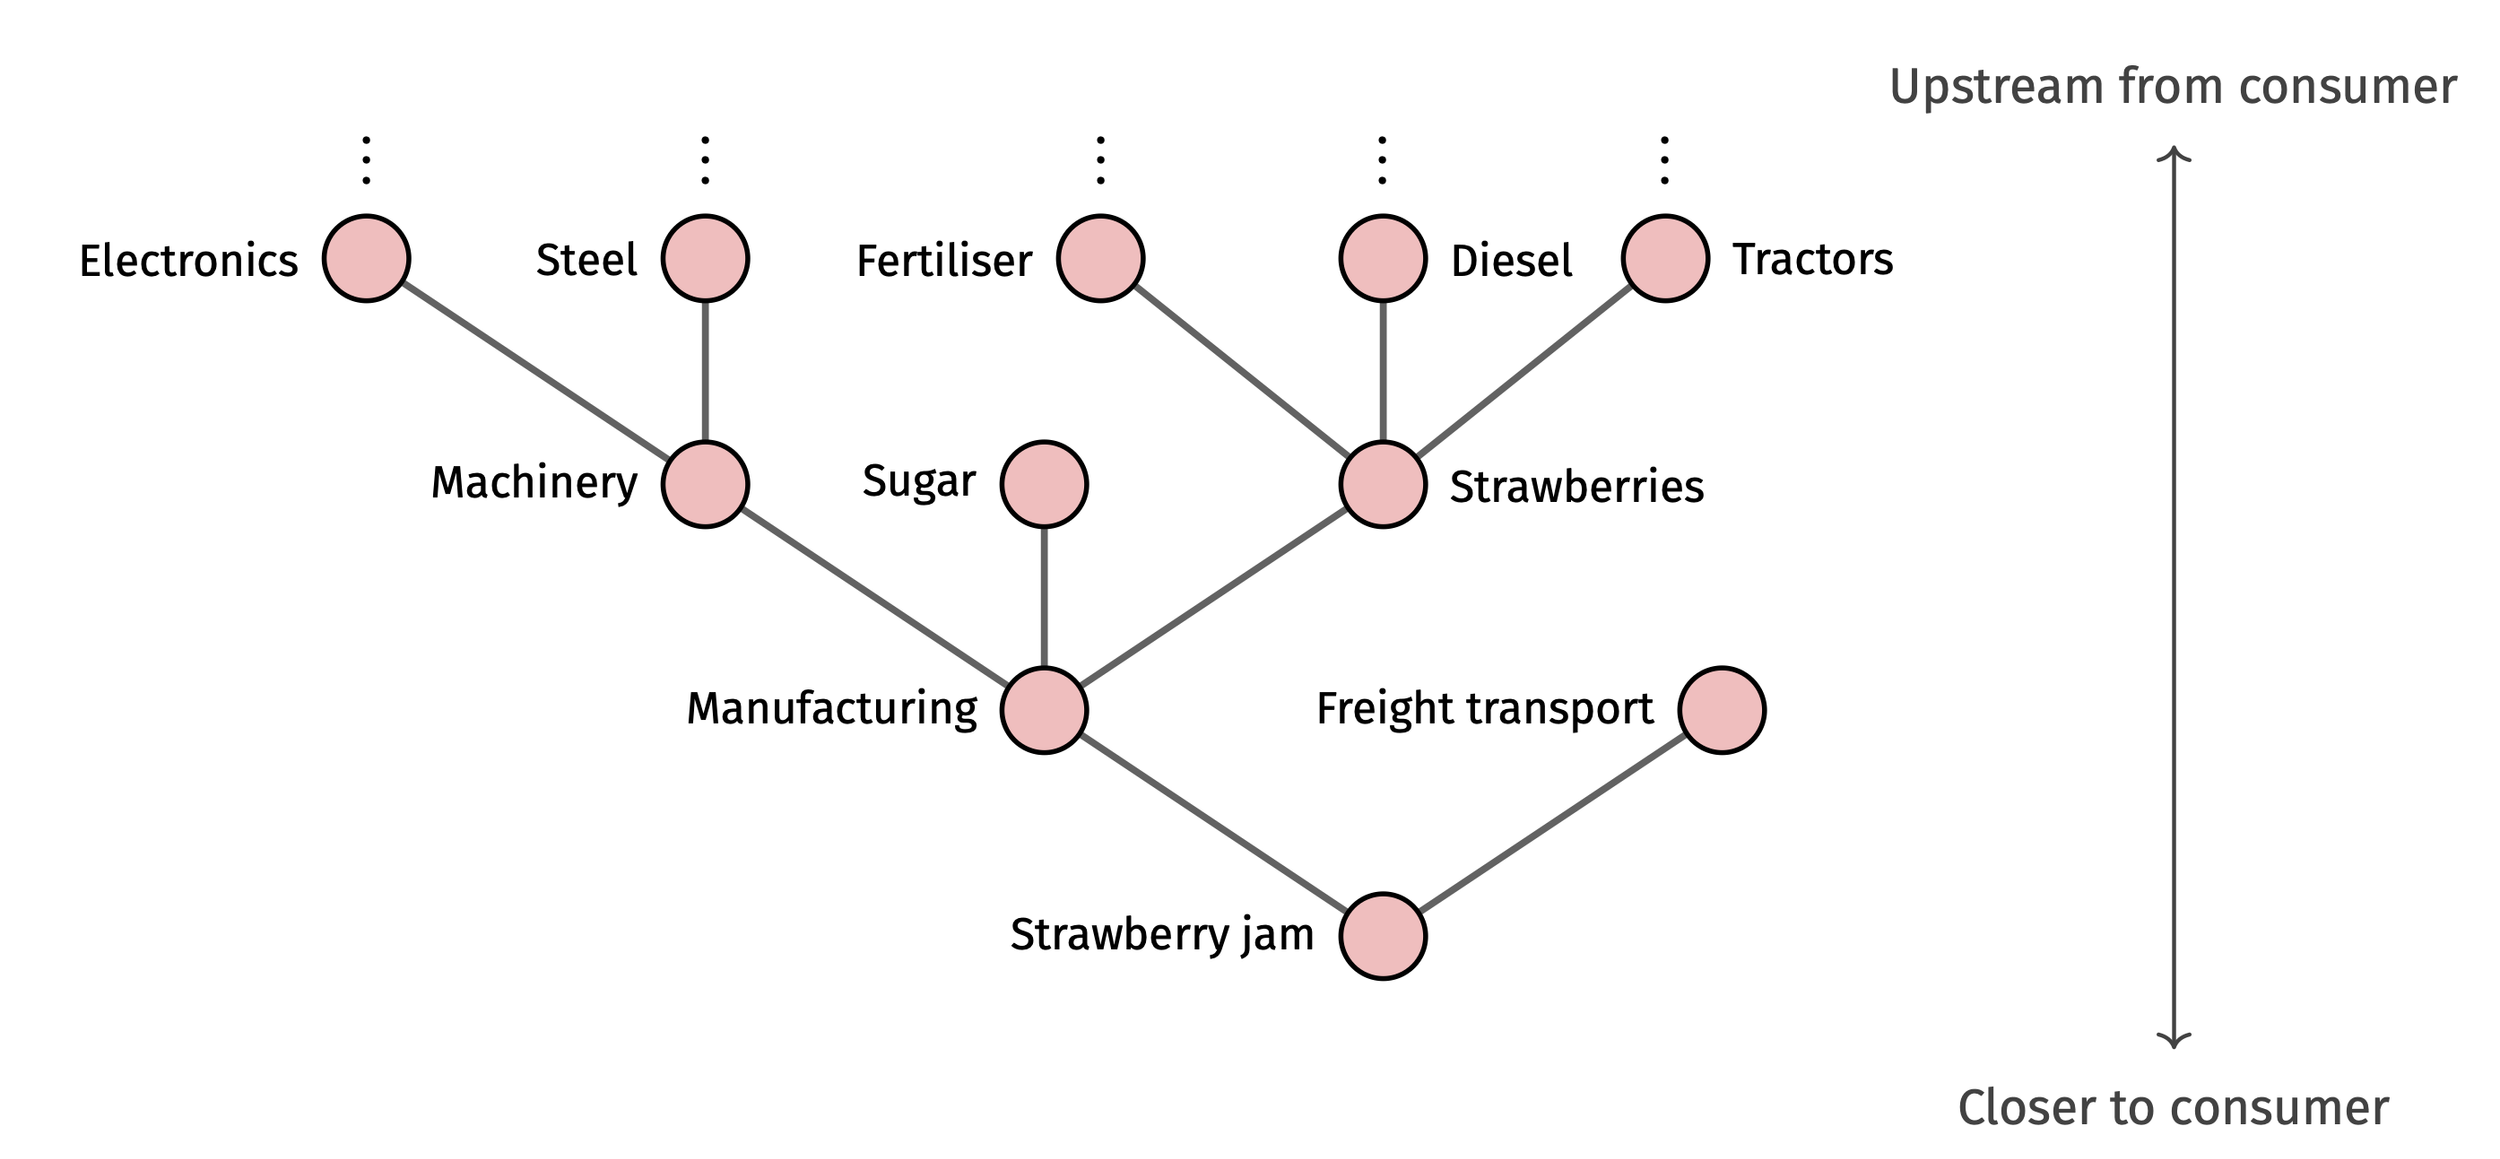
Using these models allows us to peel-back the production layers and traverse the supply chain, hopefully revealing more of the underlying physical reality. This is demonstrated in the fictitious strawberry jam supply chain shown above. Each step away from the consumer upstream reveals another production layer and set of inputs. These techniques rely on large environmental economic models which knit together the world’s production, trade, consumption and environmental data [6]. The models give us insights into the far fringes of our supply chains, however represent reality only in aggregate – individual supply chains may deviate from those in the model.
Other tools exist to follow goods along supply chains in real-time, and have applications in the freight transport, fishing, cold-chain and food industries [7]. These tools come under the broad heading of supply-chain transparency and chain-of-custody techniques [8]. These techniques differ from the supply chain models in that they usually track an individual product, rather than attempting to account for the innumerable contributing components to a complex product.
These tools are all attempts to reconstruct the past of a product and provide consumers better information about the real costs and environmental impacts of their purchases. However, perhaps this strategy has limits: we may not be able to unravel the full impacts of our actions in the world and therefore should tread as lightly as possible.
[1] See for example, https://en.wikipedia.org/wiki/Fundamental_theorem_of_software_engineering
[2] https://www.joelonsoftware.com/2002/11/11/the-law-of-leaky-abstractions/
[3] Erb at al., 2009, Embodied HANPP: Mapping the spatial disconnect between global biomass production and consumption, Ecological Economics
[4] Peters, G et al., 2011, Growth in emission transfers via international trade from 1990 to 2008, PNAS
[5] Techniques such as Input-output Analysis and Life Cycle Assessment.
[6] These databases include EXIOBASE, GLORIA, EORA and others.
[7] See for example: https://www.enkibox.com.au/, https://opensc.org/.
[8] https://hbr.org/2019/08/what-supply-chain-transparency-really-means
This post first appeared on the Shrunk Labs blog: https://shrunk.ai/blog/f/supply-chain-abstraction-and-reality
Ports and ocean sea lanes
A mashup of sea lane GIS data and world port definitions. These datasets have a few applications, for example the path and distance traversed by a ship is useful for calculating freight transport carbon emissions. While more complete ship route data sets are available, for example using satellite AIS positioning systems, generally these are not publically available in GIS formats.
Supply chain tools for modern slavery
In 2018, Australia passed into the law the Modern Slavery Act, requiring companies to investigate and report on modern slavery in their supply chains. [1]
The OAASIS [2] project (the Open Analysis of Slavery in Supply Chains) aims to harness the power of input-output analysis to assist companies and governments to understand how slavery is embodied in the supply chains of goods and services that Australian's consume. OAASIS hopes also to build tools that help companies comply with the Act.
Part of this work is to assemble and compile a collection of tools that can be used to calculate modern slavery footprints. For example the make-labour-satellite python repo (https://github.com/modern-slavery-open-lib/make-labour-satellite) reads in several modern-slavery and 'problematic labour' datasets and casts them to the GLORIA MRIO [3] classification - enabling them to be used with GLORIA to calculate footprints [4]. The first datasets we have added is from Shilling (2021) [5] and also the ILO [6].
If you would like to be involved, or know of some good labour data, please reach out!
[1]: Modern Slavery Act: https://www.legislation.gov.au/Details/C2018A00153
[2]: The OAASIS project: https://www.sydney.edu.au/science/our-research/research-areas/physics/big-data-combatting-modern-slavery.html
[3]: GLORIA MRIO: https://ielab.info/analyse/gloria
[4]: The data is converted to the GLORIA classfication using the mapping operation: x'(1.p) = x(1.n) Msr(n.m) Msr(m.p)
[5]: Shilling et al., 2021, Modern slavery footprints in global supply chains, Journal of Industrial Ecology, https://doi.org/10.1111/jiec.13169
[6]: International Labour Organization: https://www.ilo.org/global/statistics-and-databases/lang--en/index.htm
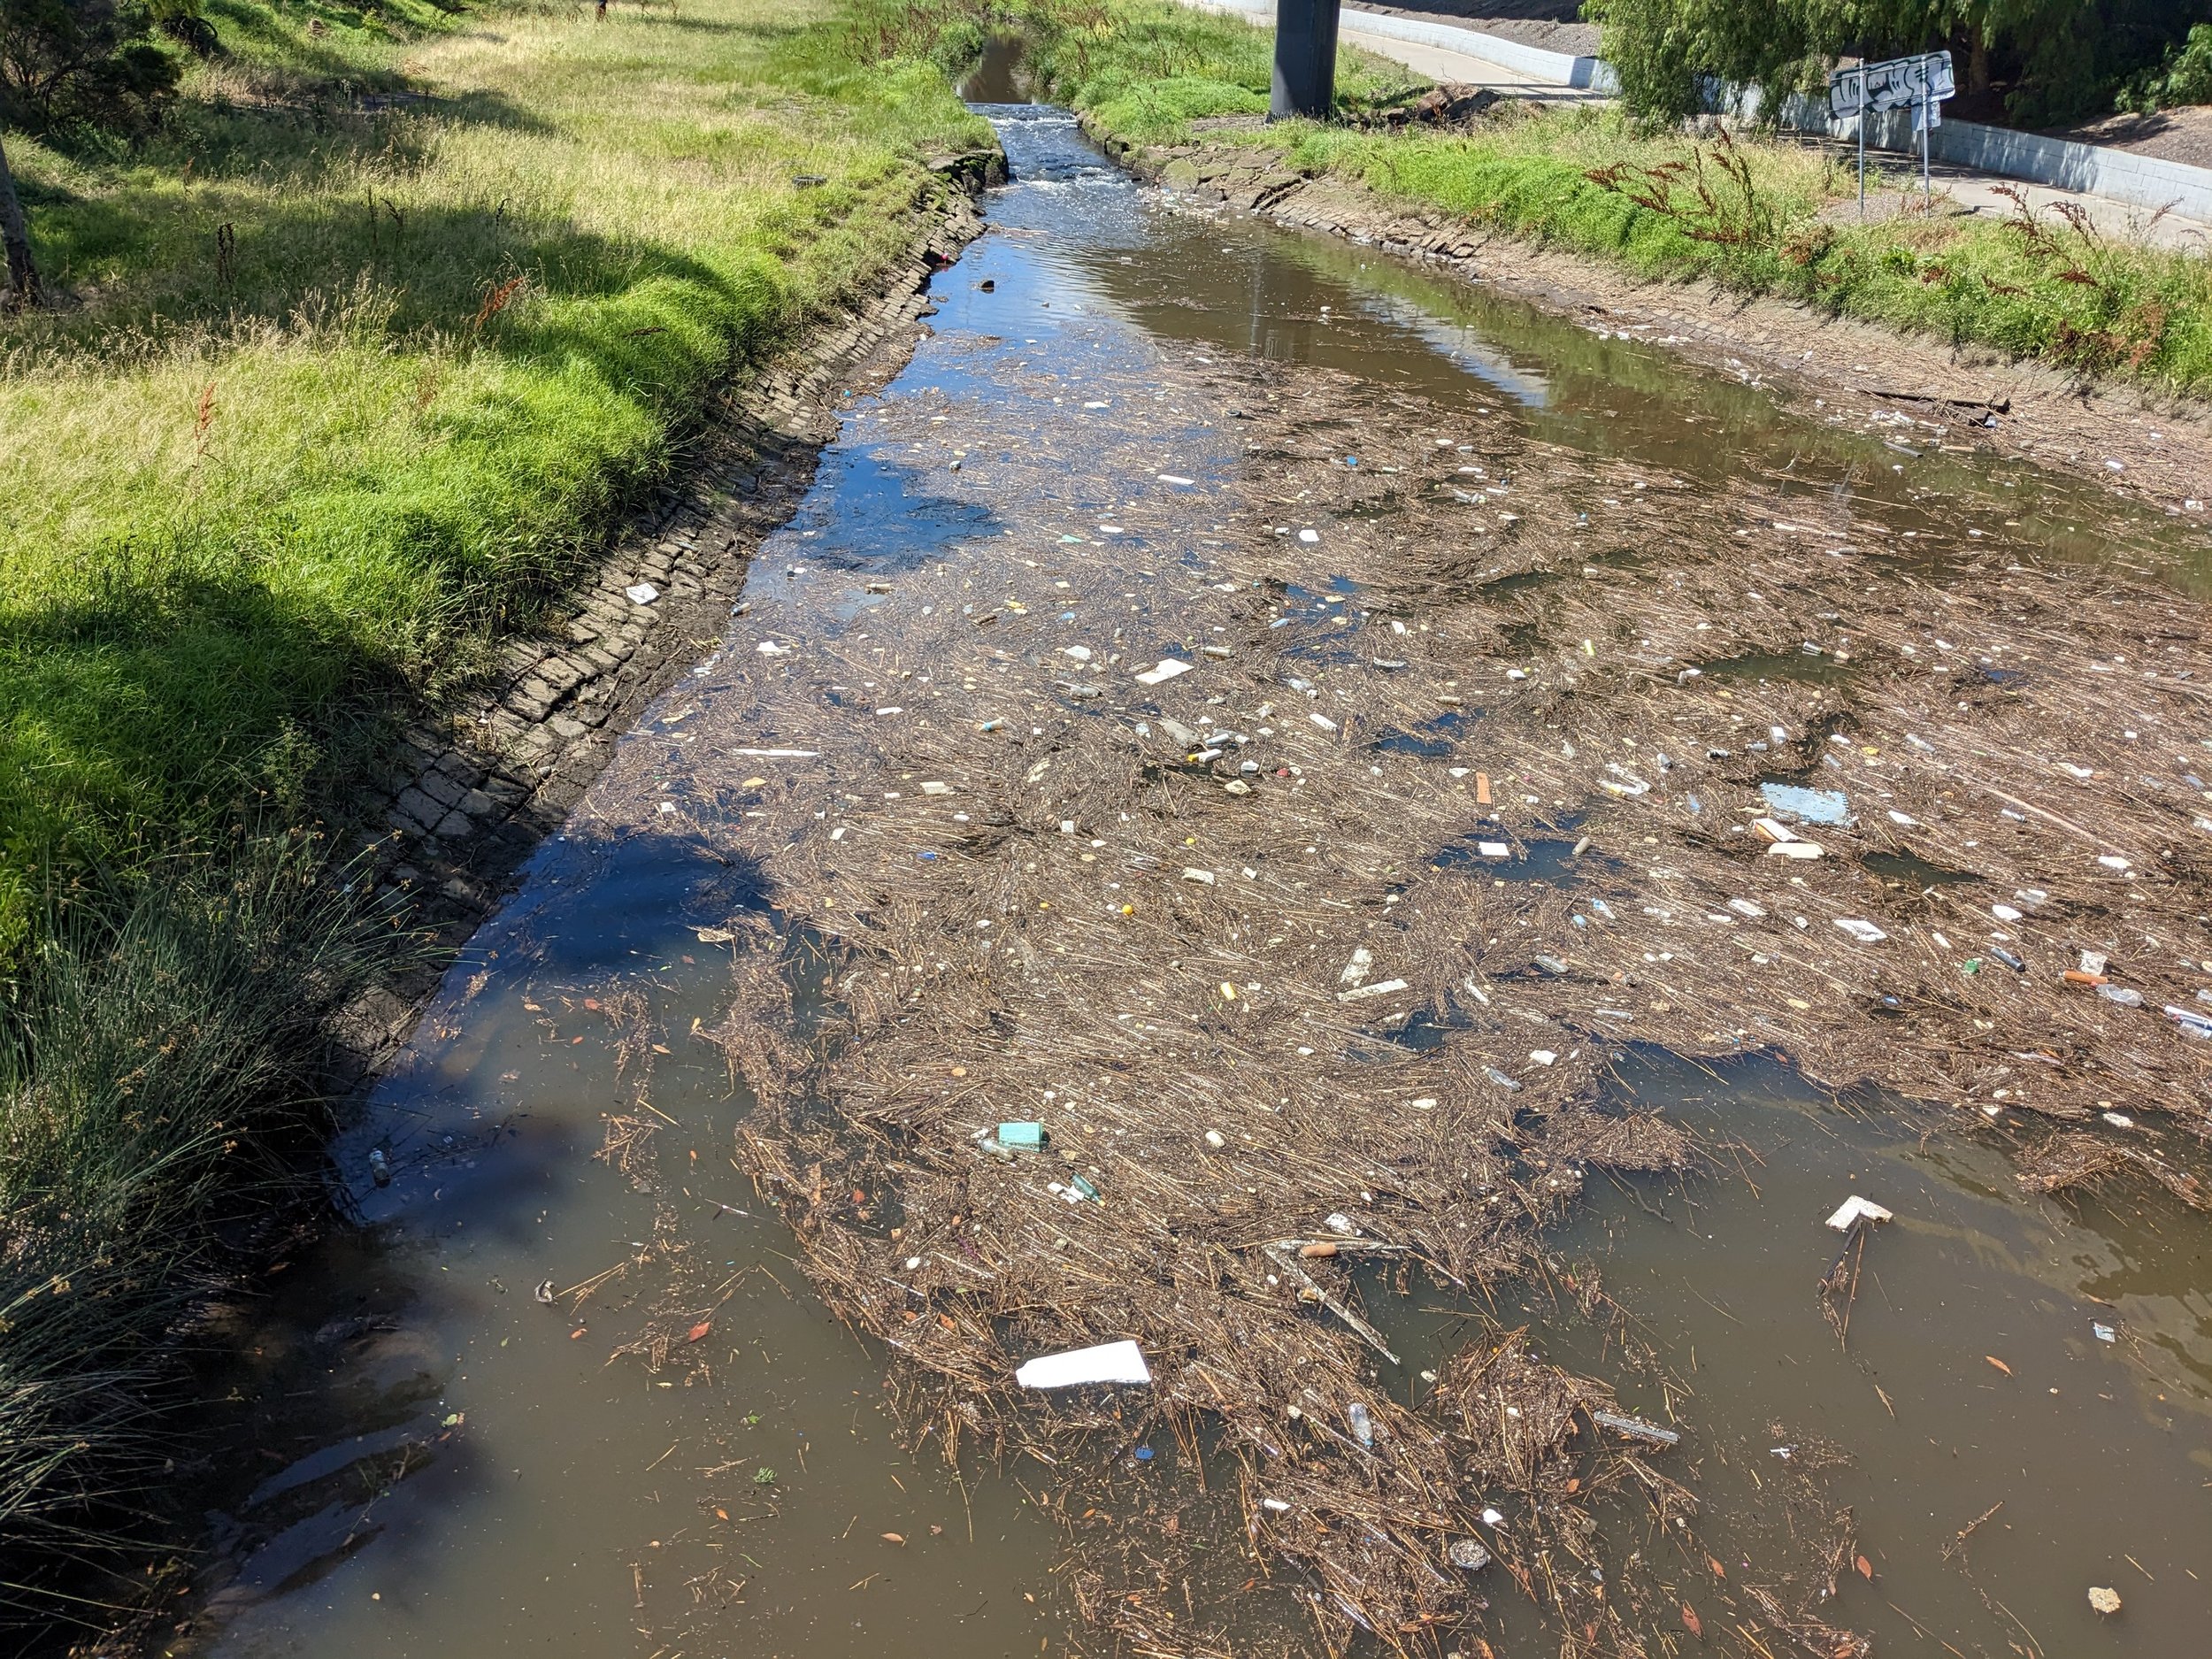
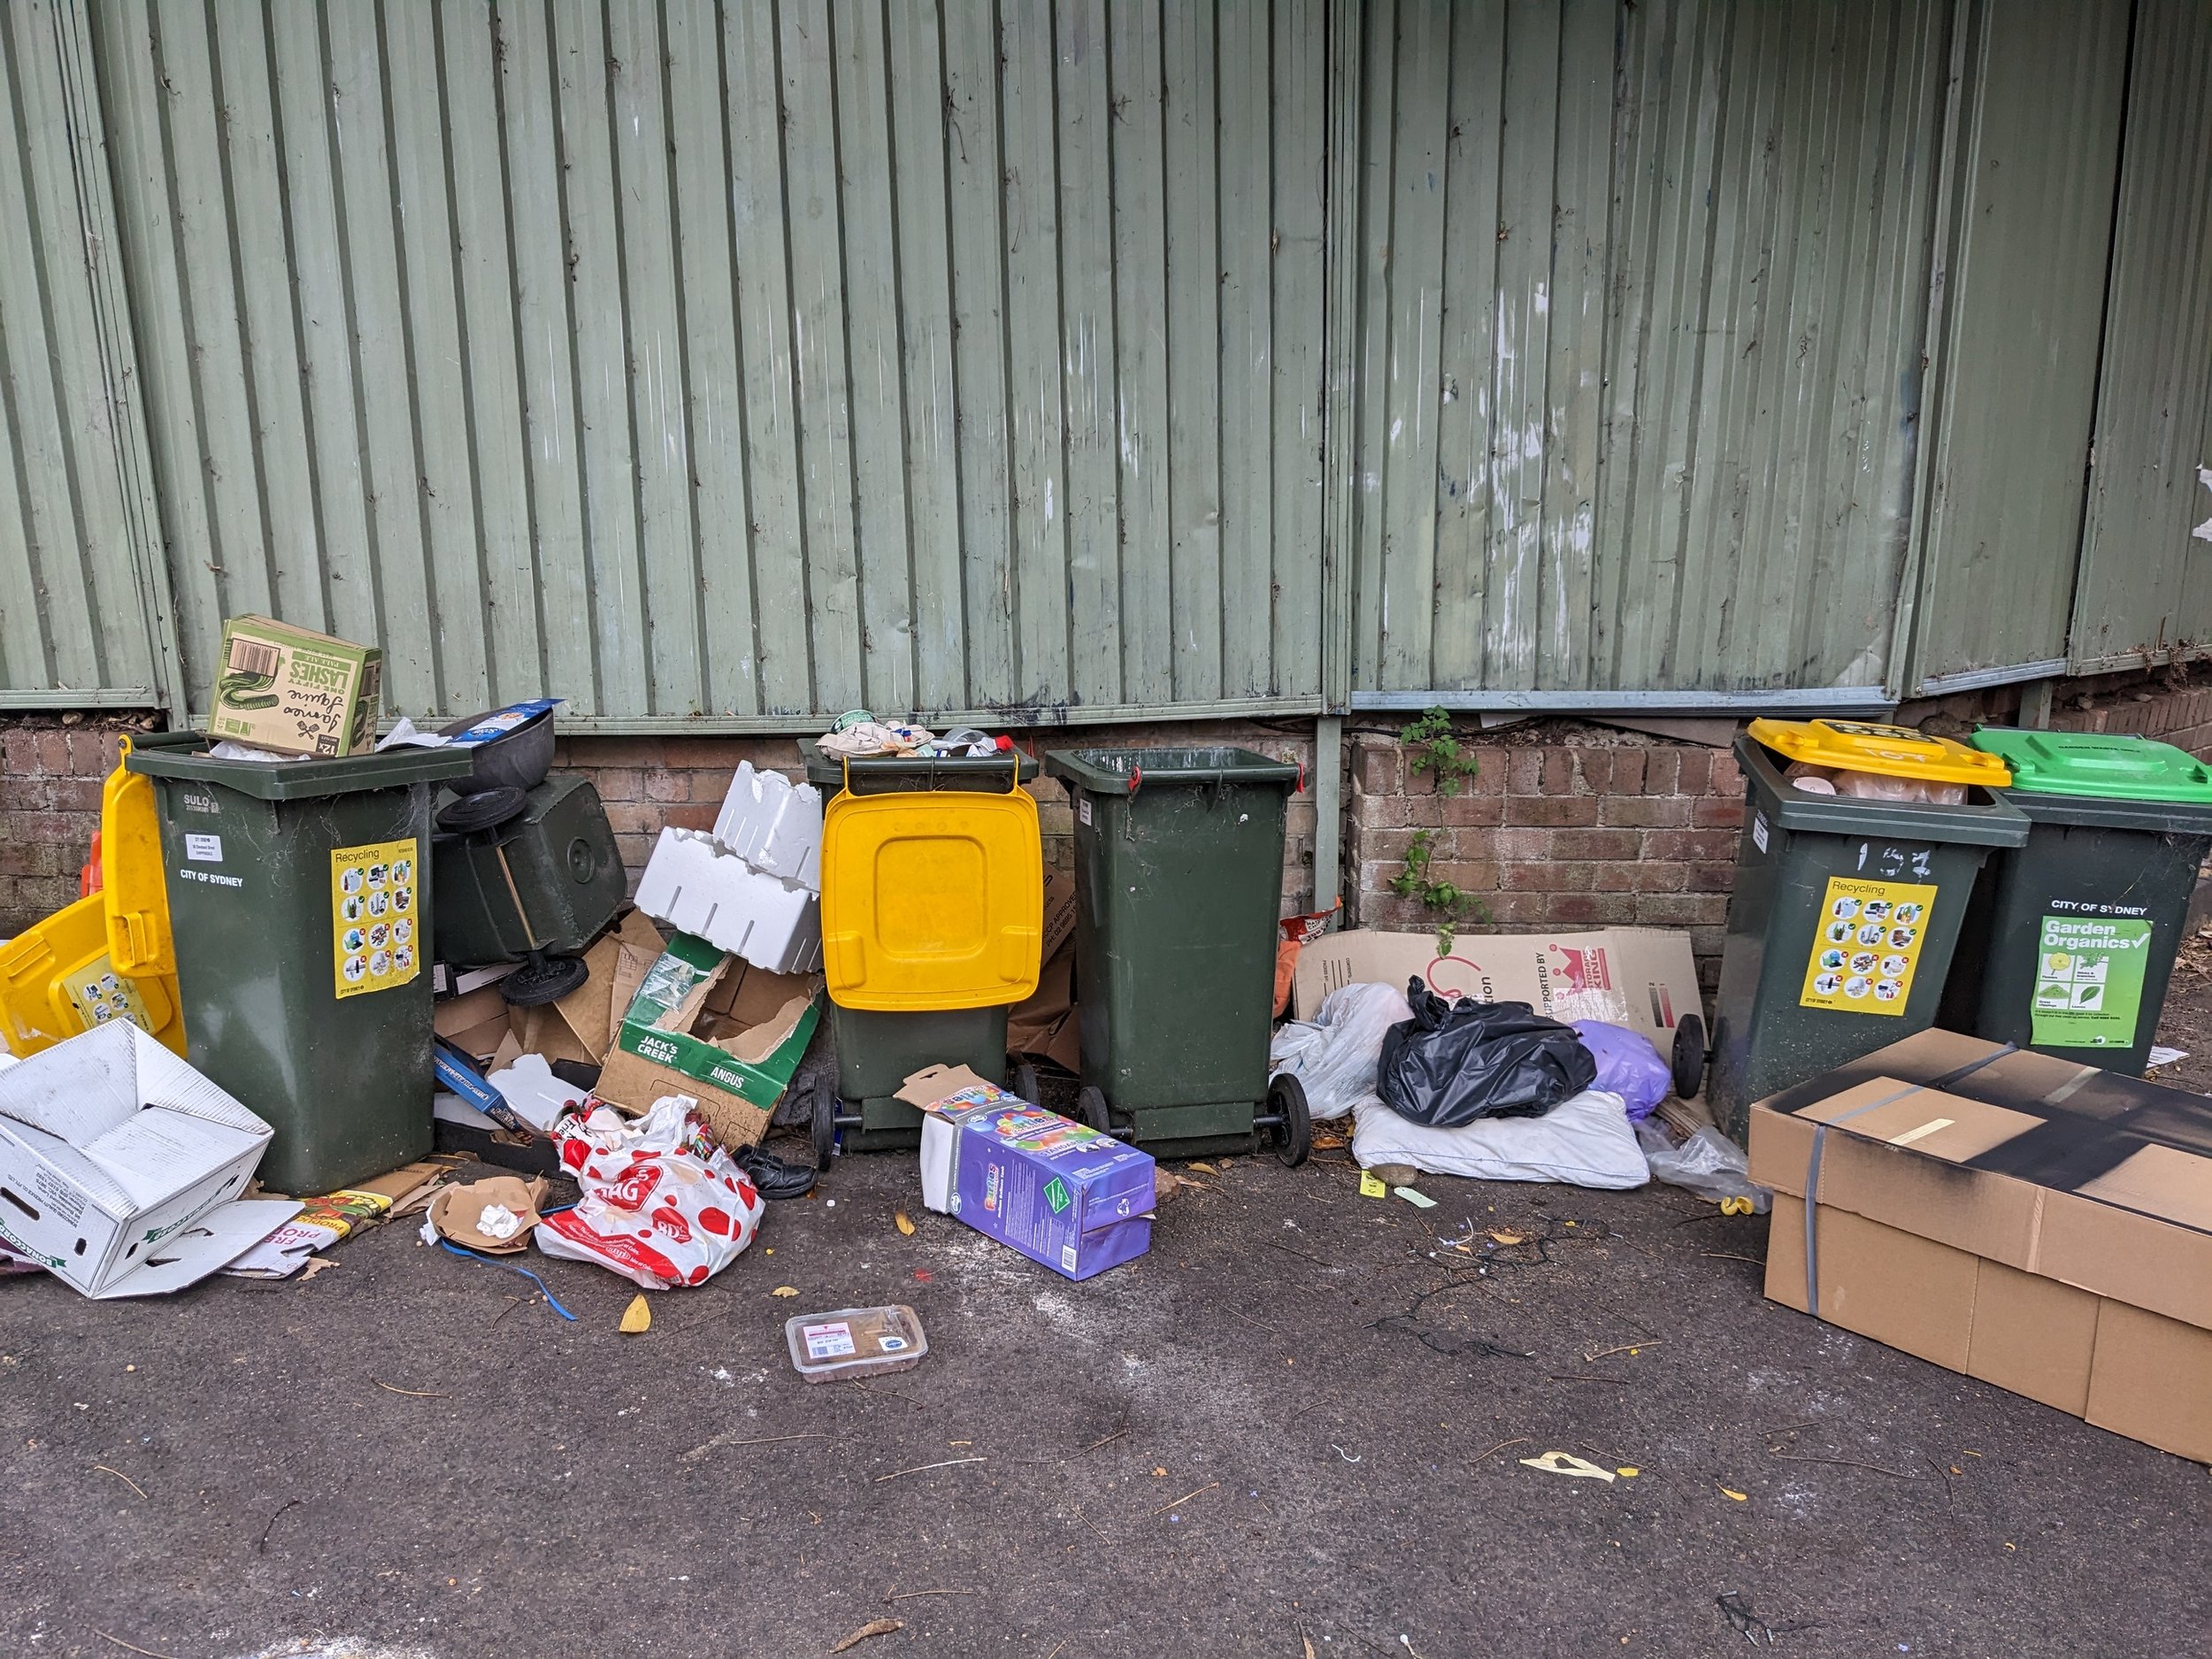
Urban waste


Biodiversity impacts and nested trade models
Usually MRIO models are either global or subnational, with global models containing international trade relations between nations and subnational models containing trade between regions within a country. However neither of these models detail the relationships between local centers of production and global consumption. Specifying these relations requires a “nested” model, where the subnational models is nested with a global model.
Recently we constructed a nested MRIO model, featuring extensive subnational and global trade detail, and information on imports and exports between subnational Australian regions and global regions. Our aim was to show how a nested MRIO model offers a more accurate quantification of localized impacts than use of global-only models. To this end, we traced Australian beef along international trade routes, destined for consumption in the USA.
We linked the nested MRIO model with data on biodiversity threats from the International Union for Conservation of Nature (IUCN) Red List of Threatened Species, specifically “Animalia” kingdom that are listed as “Critically Endangered”, “Endangered”, and “Vulnerable”, and that are threatened by livestock farming (by both smallholders and agro-industry) in all Australian regions. We highlight the distribution of threats obtained from the nested MRIO model to show the power of this nesting technique in capturing localized impacts, specifically in the Northern regions of Australia, which export beef to the USA.
For more detail see: https://pubs.acs.org/doi/10.1021/acs.est.1c08804
Distribution of biodiversity threats in Australia, driven by beef consumption in the USA: based on the global model.
Distribution of biodiversity threats in Australia, driven by beef consumption in the USA: based on a nested model
UN Comtrade and MRIO integration

I recently worked on a pipeline to pre-process the UN Comtrade dataset before it is incorporated into the GLORIA MRIO. GLORIA (Global Resource Input-Output Assessment) is a multi-regional input-output (MRIO) database that was built by the University of Sydney using the IELab infrastructure for the UN International Resource Panel (UN IRP). GLORIA has 164 regions, 120 sectors per region, forms a continuous time series for 1990-2020 and is one of the largest and most up-to-date published MRIO databases (at the time of writing).
While the Comtrade1 is an excellent source of bilateral trade data, there are issues with this dataset that must be resolved before the data can be incorporated into a MRIO framework. These issues include:
- Comtrade contains 2 perspectives on the same trade, representing both the importer and exporter’s reports. However the values of these data points do not always agree, and in some cases one is zero and the other is not.
- UN SNA MA trade data provides an additional trade dataset, and is taken to be the point-of-truth. SNA MA details total imports and exports by country, however these totals do not agree with the combined totals from the Comtrade and Services trade databases. UN SN MA sets total import and exports by country but not bilateral trading pairs.
- Trade in certain commodities contains gaps (zero entries) in the timeseries, where such a gap is unlikely to occur in reality.
The raw UN Comtrade and Services trade data are unpacked into a sparse tensor H, with elements hivrst, and where r and s are the origin and destination countries respectively. t indexes the year dimension. Commodities and services categories are indexed by i, using the custom classification HSCPC (containing > 6,357 distinct categories). HSCPC is the union of the HS (commodities) and CPC (services) classification systems. The index v denotes valuation, where imports (v = 1) are valued as CIF (purchaser’s prices) and exports (v = 2) are valued as FOB (producer or basic prices).
A reconciliation algorithm is then implemented to resolve the errors and inconsistencies in the Comtrade database. A RAS procedure involving a series of scaling operations is used; the sparse tensor data structure makes this scaling relatively easy to implement. Smoothing is also implemented to fill zero entries.
1 The term ‘Comtrade’ is used lazily here to refer to both the UN’s Comtrade and Services trade databases.
Still waters run deep
Recently Shrunk set out on a journey to build an open, affordable and flexible method for minimising energy related emissions for industrial, residential and remote applications. Deepwater is a microgrid optimisation service, enabling the ideal design and control of on-site renewable generation, storage and local energy consumers.
Deepwater allows sites to actively minimise (or avoid entirely) their exposure to energy grid related emissions, reliability and cost structures. Deepwater creates a custom-built predictive control strategy, tuned specifically for local conditions and profiles of operation that are unique to each facility. The control is designed and optimised to achieve desired site-specific objectives such as reductions in emissions, cost or enhancing energy resilience ensuring complete flexibility for clients.
Deepwater is interoperable with existing systems installed at your site, both physical infrastructure and any digital monitoring and control platforms. Deepwater is technologically agnostic and simply drives the most value and best environmental outcome out of the existing infrastructure, without locking you in a walled-garden. Participating in the service only takes a few simple steps.
Deepwater is currently in alpha-testing, and we welcome anyone interested in partnering with us to develop it further or you would like to discuss further please get in touch or visit www.deepwater.studio.
Plastics recycling and industrial metabolism
Recently, Shrunk had the opportunity to visit a plastics recycling facility on the outskirts of Melbourne. The size and scale of the operation was overwhelming and we thank our hosts for the amazing tour!
The facility takes a mixed-plastics waste stream and, after a complex series of operations, produces recycled plastic. A network of conveyor belts carries the plastic waste through each processing stage, with specialised robots operating within protective cages to separate each plastic type [1]. The waste is cleaned and decontaminated before high-temperature processes melt and reform the material into recycled plastic pellets and flakes. This finished product is ready to be used as an input into new production.
This facility is an excellent example of the processing level and technology required if we are to move from our linear 'take-make-waste' economy towards something more circular [2,3]. In a ‘circular economy’, materials are continuously cycled within the system, which minimises the extraction of virgin material and minimises material sent as waste to landfill.
While impressive, this complex process of separating and remaking plastics is not ‘free’, the process of sorting and remelting can be energy intensive. One of the reasons sorting and separating consumes energy is that we are working against the mixing entropy [4]. The ‘mixed-plastics’ waste stream is in a disordered state, in the thermodynamic sense, whereas the sorted and separated result is highly ordered. We need to do work on the system to undo the mixing, this work requires energy. Further, because the waste stream can be very contaminated (e.g. drink bottle labels and organics are forms of contamination), a certain portion of the waste stream is essentially un-sortable and is diverted to landfill.
During our tour we noticed the large number of HDPE and PET plastic containers that had arrived at the facility – milk bottles, laundry detergent containers and shampoo bottles. An alternative to sorting and remelting these containers is to design them for reuse, rather than recycling. Reuse can be designed in a number of ways, including: refillable by bulk container (customer brings own container to store), returnable packaging (customer returns and retailer or manufacturer cleans and reuses), reusable transit packaging (pallets or boxes used for shipping are returned to the freight company) [5]. These designs are not new, though currently not prevalent. Reuse can come with its own challenges however, for example the energy and water consumption used during food container cleaning can be significant. These issues highlight the importance of the produce design phase in reducing environmental impacts from material use.
Resources
[1] Plastic ID codes: https://chemistryaustralia.org.au/Content/PIC.aspx
[2] https://www.gsb.stanford.edu/insights/replacing-take-make-waste-model-sustainable-supply-chains
[3] Circular Economy Victoria: https://www.cev.org.au/
[4] Gutowski & Dahmus, 2005, Mixing Entropy and Product Recycling, https://web.mit.edu/ebm/www/Publications/Gutowski_ISEE_2005.pdf
[5] Coelho, PM, 2021, Sustainability of reusable packaging–Current situation and trends, Resources, Conservation & Recycling: X
Cross-posted from the Shrunk Labs blog: https://shrunk.ai/blog/f/waste-plastics-and-the-circular-economy
A day out with farmer incubator at Day's Walk Farm
A day out with farmer incubator at Day's Walk Farm.