waste & circular economy

Vehicle recycling

Recently, I had the opportunity to visit a passenger vehicle dismantler and recycler here in Japan. This facility was interesting because of the range of activities conducted at the site, as well as the care taken in material recovery.

This facility dismantles vehicles non-destructively, which maximises the number of parts that can be reused. This careful dismantling requires more time and skilled labour than other approaches, but results in more intact parts that can be reused. At another recycling facility, I have seen whole engine blocks removed using an excavator with a pincer attachment, which is fast though causes significant damage.

The vehicle parts recovered at this facility are exported to foreign markets. For these parts to retain value on the used parts market, there must be some demand from the vehicle stock in the destination country, and parts need to be in good-condition. It was obvious some work would be required to sort, clean and test the tangle of parts before reuse would be possible.

Parts that cannot be reused are transferred to other facilities for further processing, for example electric wiring harnesses are shipped for shredding and crushing to recover the bare copper insider.

This facility also has the capability to melt and recast scrap iron into basic parts. While these recast are relatively simple products, this allows the facility to perform provide value-added services. Care must be taken to avoid contaminating the melt with other materials and metal alloys.

For a further discussion about relationship to materials in our society see https://www.quoll.co/blog/repairing-our-material-relationships.


Australian waste plastics flows

Plastics waste is a significant issue in Australia, with plastics waste generation continuing to grow. Central to idea of a ‘circular economy’ is that waste materials flow back into production, to be remade into new products. However, in Australia these flows are not visible due to limitations in published datasets. In this study, we simulated waste flows from consumption, through waste treatment and back into new production. This approach reveals how both plastics waste and recycled plastics become embodied in final consumption. The analysis shows there is currently no evidence that plastics waste generation has decoupled from either population or GDP growth. In fact, the recycling rate has declined in relative terms, potentially caused by recycling infrastructure limitations and an overall decline in Australian manufacturing.

Plastics waste data was extracted from the National Waste Database [1], however this was reshaped to make it easier to use. The reshaped data can be downloaded here: https://zenodo.org/records/12059380.


It can be seen from the figure that recycling tonnage decreases relative to total waste generation, where the ratio is calculated as recycling/total waste generation (in tonnes). One cause of this is likely the processing recycling capacity limitation in Australia [2]. The National Plastics Plan and the Recycling Modernisation Fund aim to improve this situation through the expansion of recycling infrastructure [3].Also shown in the figure 5 the decline in manufacturing’s contribution to total GDP (manufacturing gross value added/GDP), an ongoing trend in Australia for the past few decades [4]. Unfortunately, the number of local plastic resin manufacturers has decreased in recent years, with only HDPE, LDPE and PP still produced in Australia [5]. Growing Australia’s manufacturing and remanufacturing sector is part of the federal government’s Modern Manufacturing Strategy [6]. The existence of local manufacturing industries who demand recycled materials can give an advantage to local recyclers and secondary producers, for example through lower relative transport costs.


One perspective of the circular economy is that of a network, where producers and consumers are in relationship with one another, along with other actors such as waste treatment and recycling service providers. Network analysis can be employed to investigate circular economy indicators, for example the strength of interconnections between different regions and the sparsity of recycling infrastructure distribution. Network analysis has been previously used to optimise the placement of waste treatment infrastructure and production facilities. Networks are also used to define social and business relationships between actors in the circular economy, for example waste producing firms who may exchange waste products or cooperate on new product designs. The network map below was constructed to show the relationships between LGAs, population centres and waste recycling services.

This research was recently published in Resources, Conservation and Recycling.

[1] https://www.dcceew.gov.au/environment/protection/waste/national-waste-reports/2022

[2] Harford, N. and French, J. (2022). Australian Recycling Infrastructure, Capacity and Readiness (Plastic and Paper). Australian Council of Recycling; Equilibrium. https://www.acor.org.au/uploads/2/1/5/4/21549240/220623_acor_infrastructure_readiness_report_june_2022_- _updated.pdf

[3] DAWE (2021). National Plastics Plan. Department of Agriculture, Water and the Environment, Canberra. https://www.agriculture.gov.au/sites/default/files/documents/national-plastics-plan-2021.pdf.

[4] Langcake, S. (2016). Conditions in the Manufacturing Sector. Reserve Bank of Australia. https://www.rba.gov.au/publications/bulletin/2016/jun/4.html.

[5] O’Farrell, K., Harney, F., and Stovell, L. (2022). Australian Plastics Flows and Fates Study 2020-21 – National Report. Department of Climate Change, Energy, the Environment and Water; Blue Environment Pty Ltd. https://www.dcceew.gov.au/environment/protection/waste/publications/australian-plastic-flows-and-fates-report-2020-21.

[6] Tomaras, J. (2020). Waste management and recycling in Budget Review 2020–21. Department of Parliamentary Services, Australian Parliament. https://parlinfo.aph.gov.au/parlInfo/download/library/prspub/7622081/upload_binary/7622081.pdf.

Urban waste


Plastics recycling and industrial metabolism

Recently, Shrunk had the opportunity to visit a plastics recycling facility on the outskirts of Melbourne. The size and scale of the operation was overwhelming and we thank our hosts for the amazing tour!

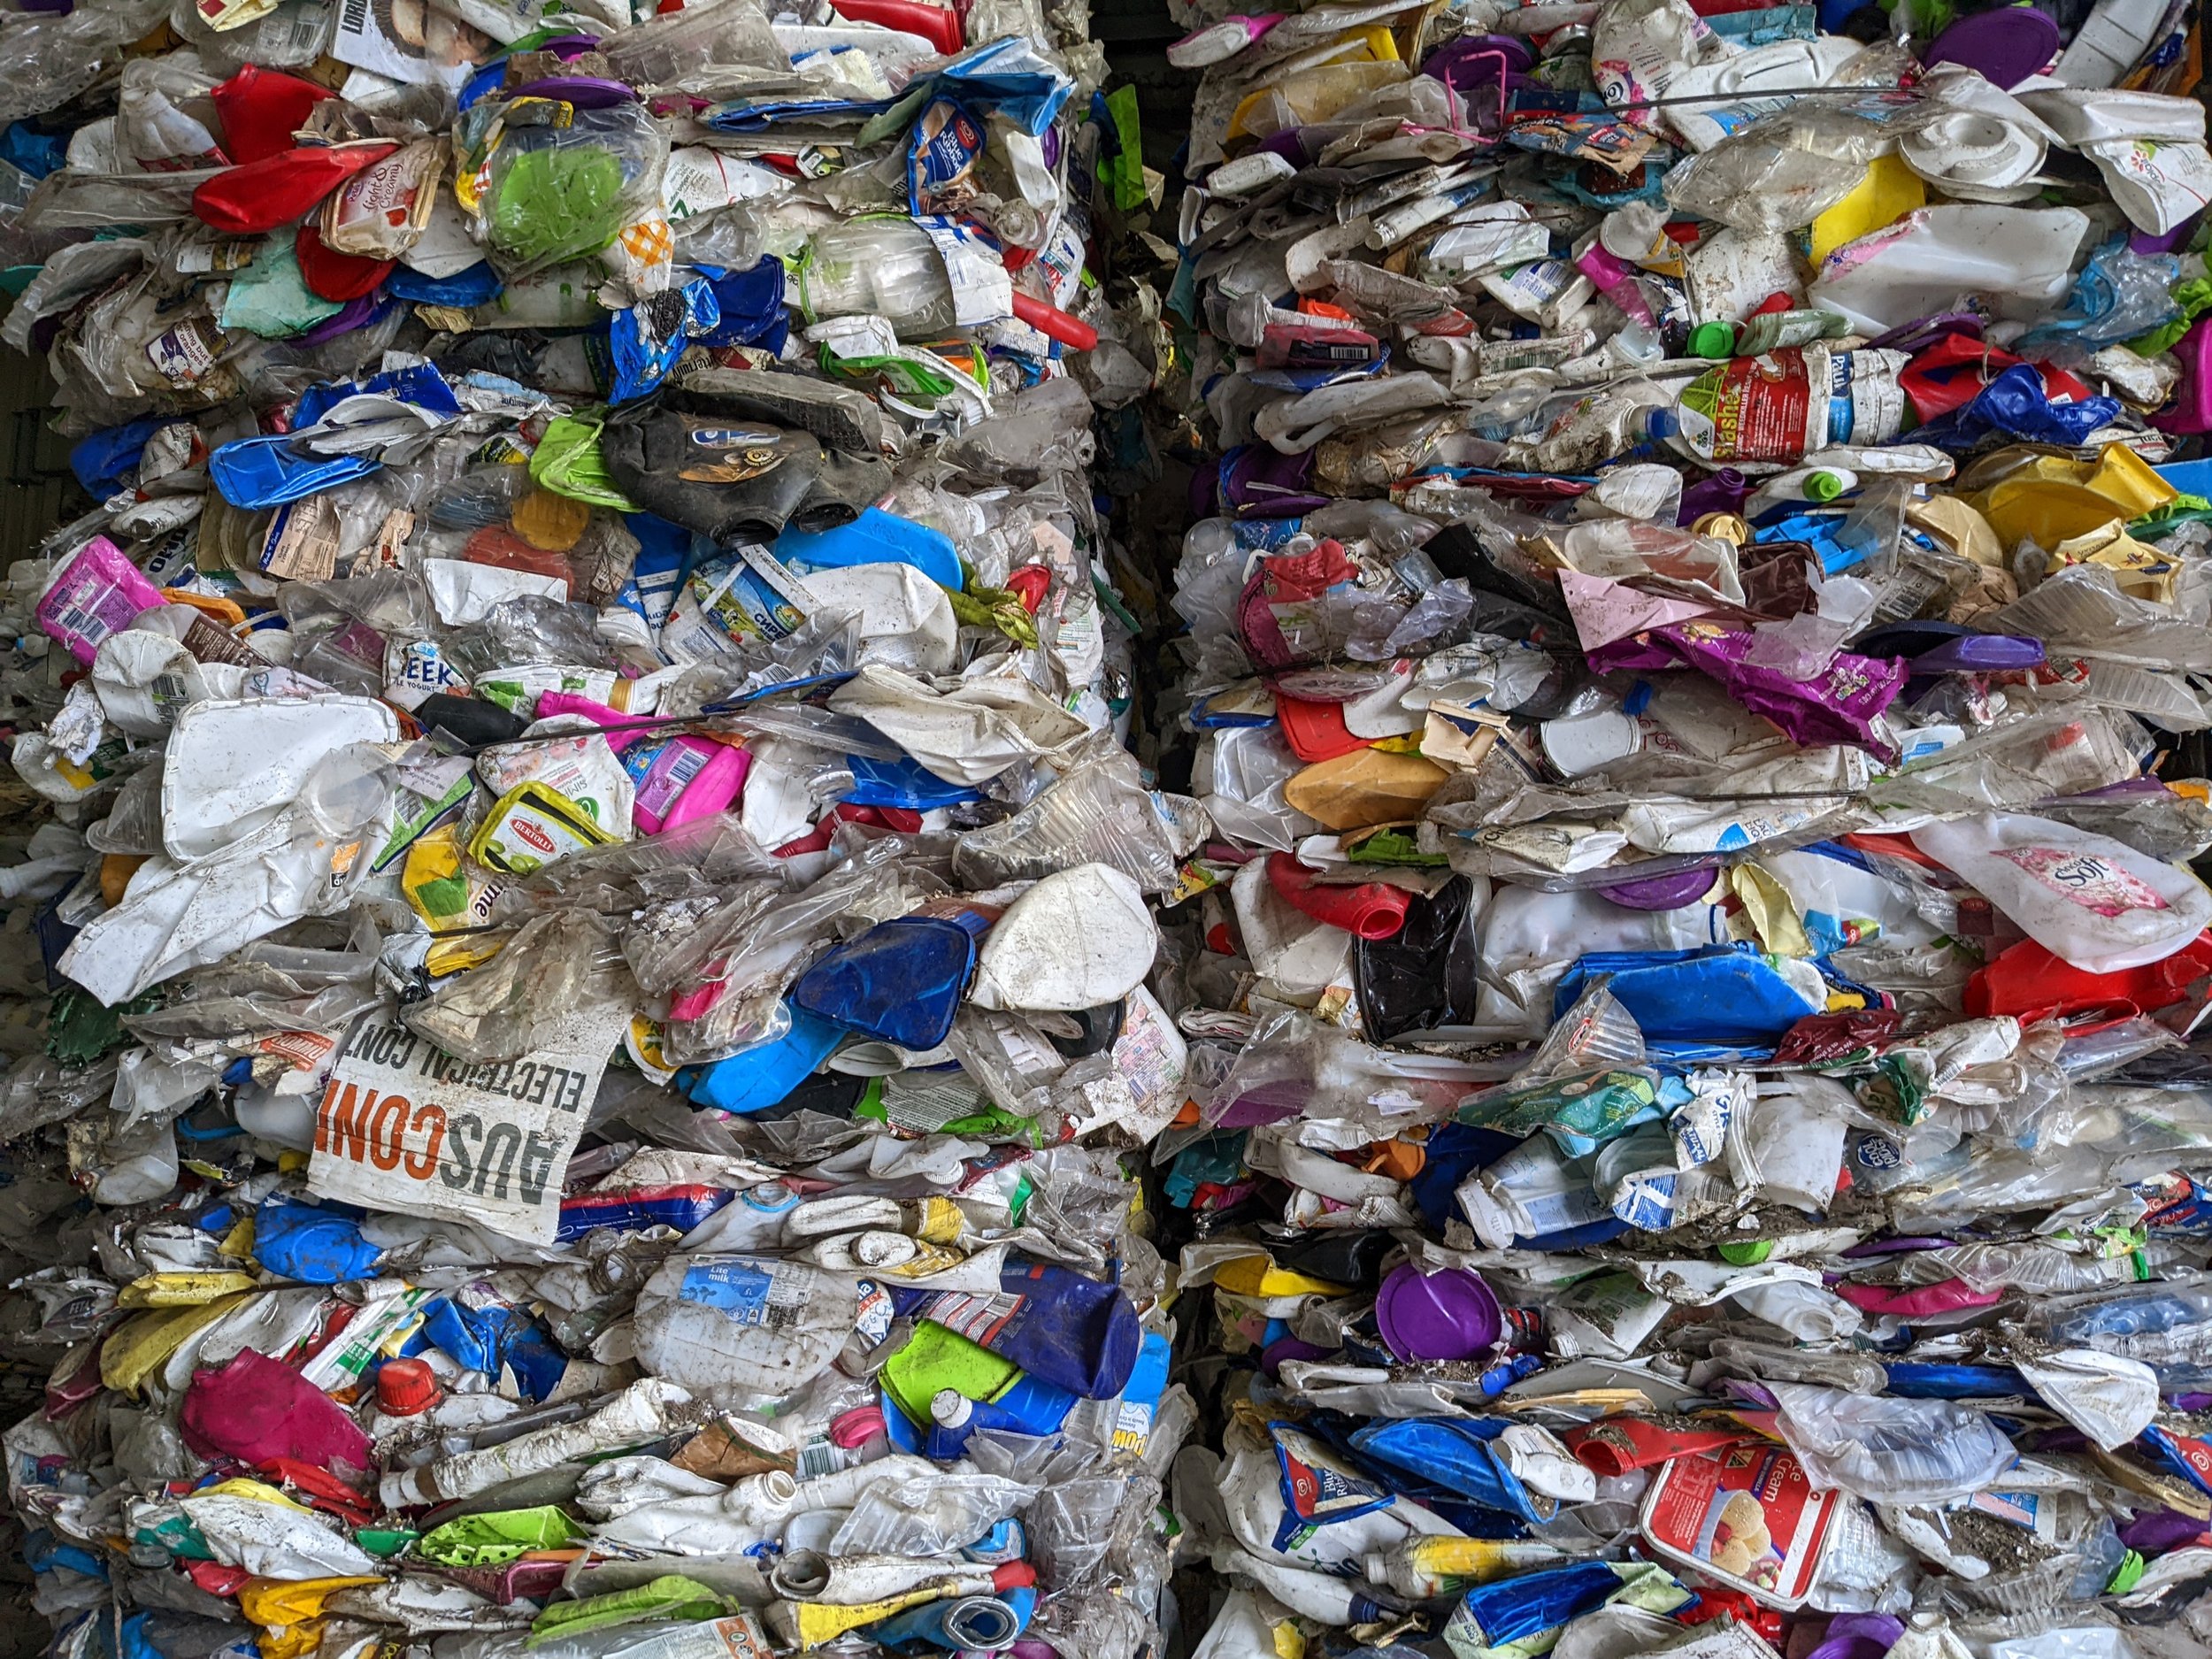
The facility takes a mixed-plastics waste stream and, after a complex series of operations, produces recycled plastic. A network of conveyor belts carries the plastic waste through each processing stage, with specialised robots operating within protective cages to separate each plastic type [1]. The waste is cleaned and decontaminated before high-temperature processes melt and reform the material into recycled plastic pellets and flakes. This finished product is ready to be used as an input into new production. 

This facility is an excellent example of the processing level and technology required if we are to move from our linear 'take-make-waste' economy towards something more circular [2,3]. In a ‘circular economy’, materials are continuously cycled within the system, which minimises the extraction of virgin material and minimises material sent as waste to landfill. 

While impressive, this complex process of separating and remaking plastics is not ‘free’, the process of sorting and remelting can be energy intensive. One of the reasons sorting and separating consumes energy is that we are working against the mixing entropy [4]. The ‘mixed-plastics’ waste stream is in a disordered state, in the thermodynamic sense, whereas the sorted and separated result is highly ordered. We need to do work on the system to undo the mixing, this work requires energy. Further, because the waste stream can be very contaminated (e.g. drink bottle labels and organics are forms of contamination), a certain portion of the waste stream is essentially un-sortable and is diverted to landfill.

During our tour we noticed the large number of HDPE and PET plastic containers that had arrived at the facility – milk bottles, laundry detergent containers and shampoo bottles. An alternative to sorting and remelting these containers is to design them for reuse, rather than recycling. Reuse can be designed in a number of ways, including: refillable by bulk container (customer brings own container to store), returnable packaging (customer returns and retailer or manufacturer cleans and reuses), reusable transit packaging (pallets or boxes used for shipping are returned to the freight company) [5]. These designs are not new, though currently not prevalent. Reuse can come with its own challenges however, for example the energy and water consumption used during food container cleaning can be significant. These issues highlight the importance of the produce design phase in reducing environmental impacts from material use.

Resources

 [1] Plastic ID codes: https://chemistryaustralia.org.au/Content/PIC.aspx

[2] https://www.gsb.stanford.edu/insights/replacing-take-make-waste-model-sustainable-supply-chains

[3] Circular Economy Victoria: https://www.cev.org.au/

[4] Gutowski & Dahmus, 2005, Mixing Entropy and Product Recycling, https://web.mit.edu/ebm/www/Publications/Gutowski_ISEE_2005.pdf

[5]  Coelho, PM, 2021, Sustainability of reusable packaging–Current situation and trends, Resources, Conservation & Recycling: X

Cross-posted from the Shrunk Labs blog: https://shrunk.ai/blog/f/waste-plastics-and-the-circular-economy


Australian circular economy atlas

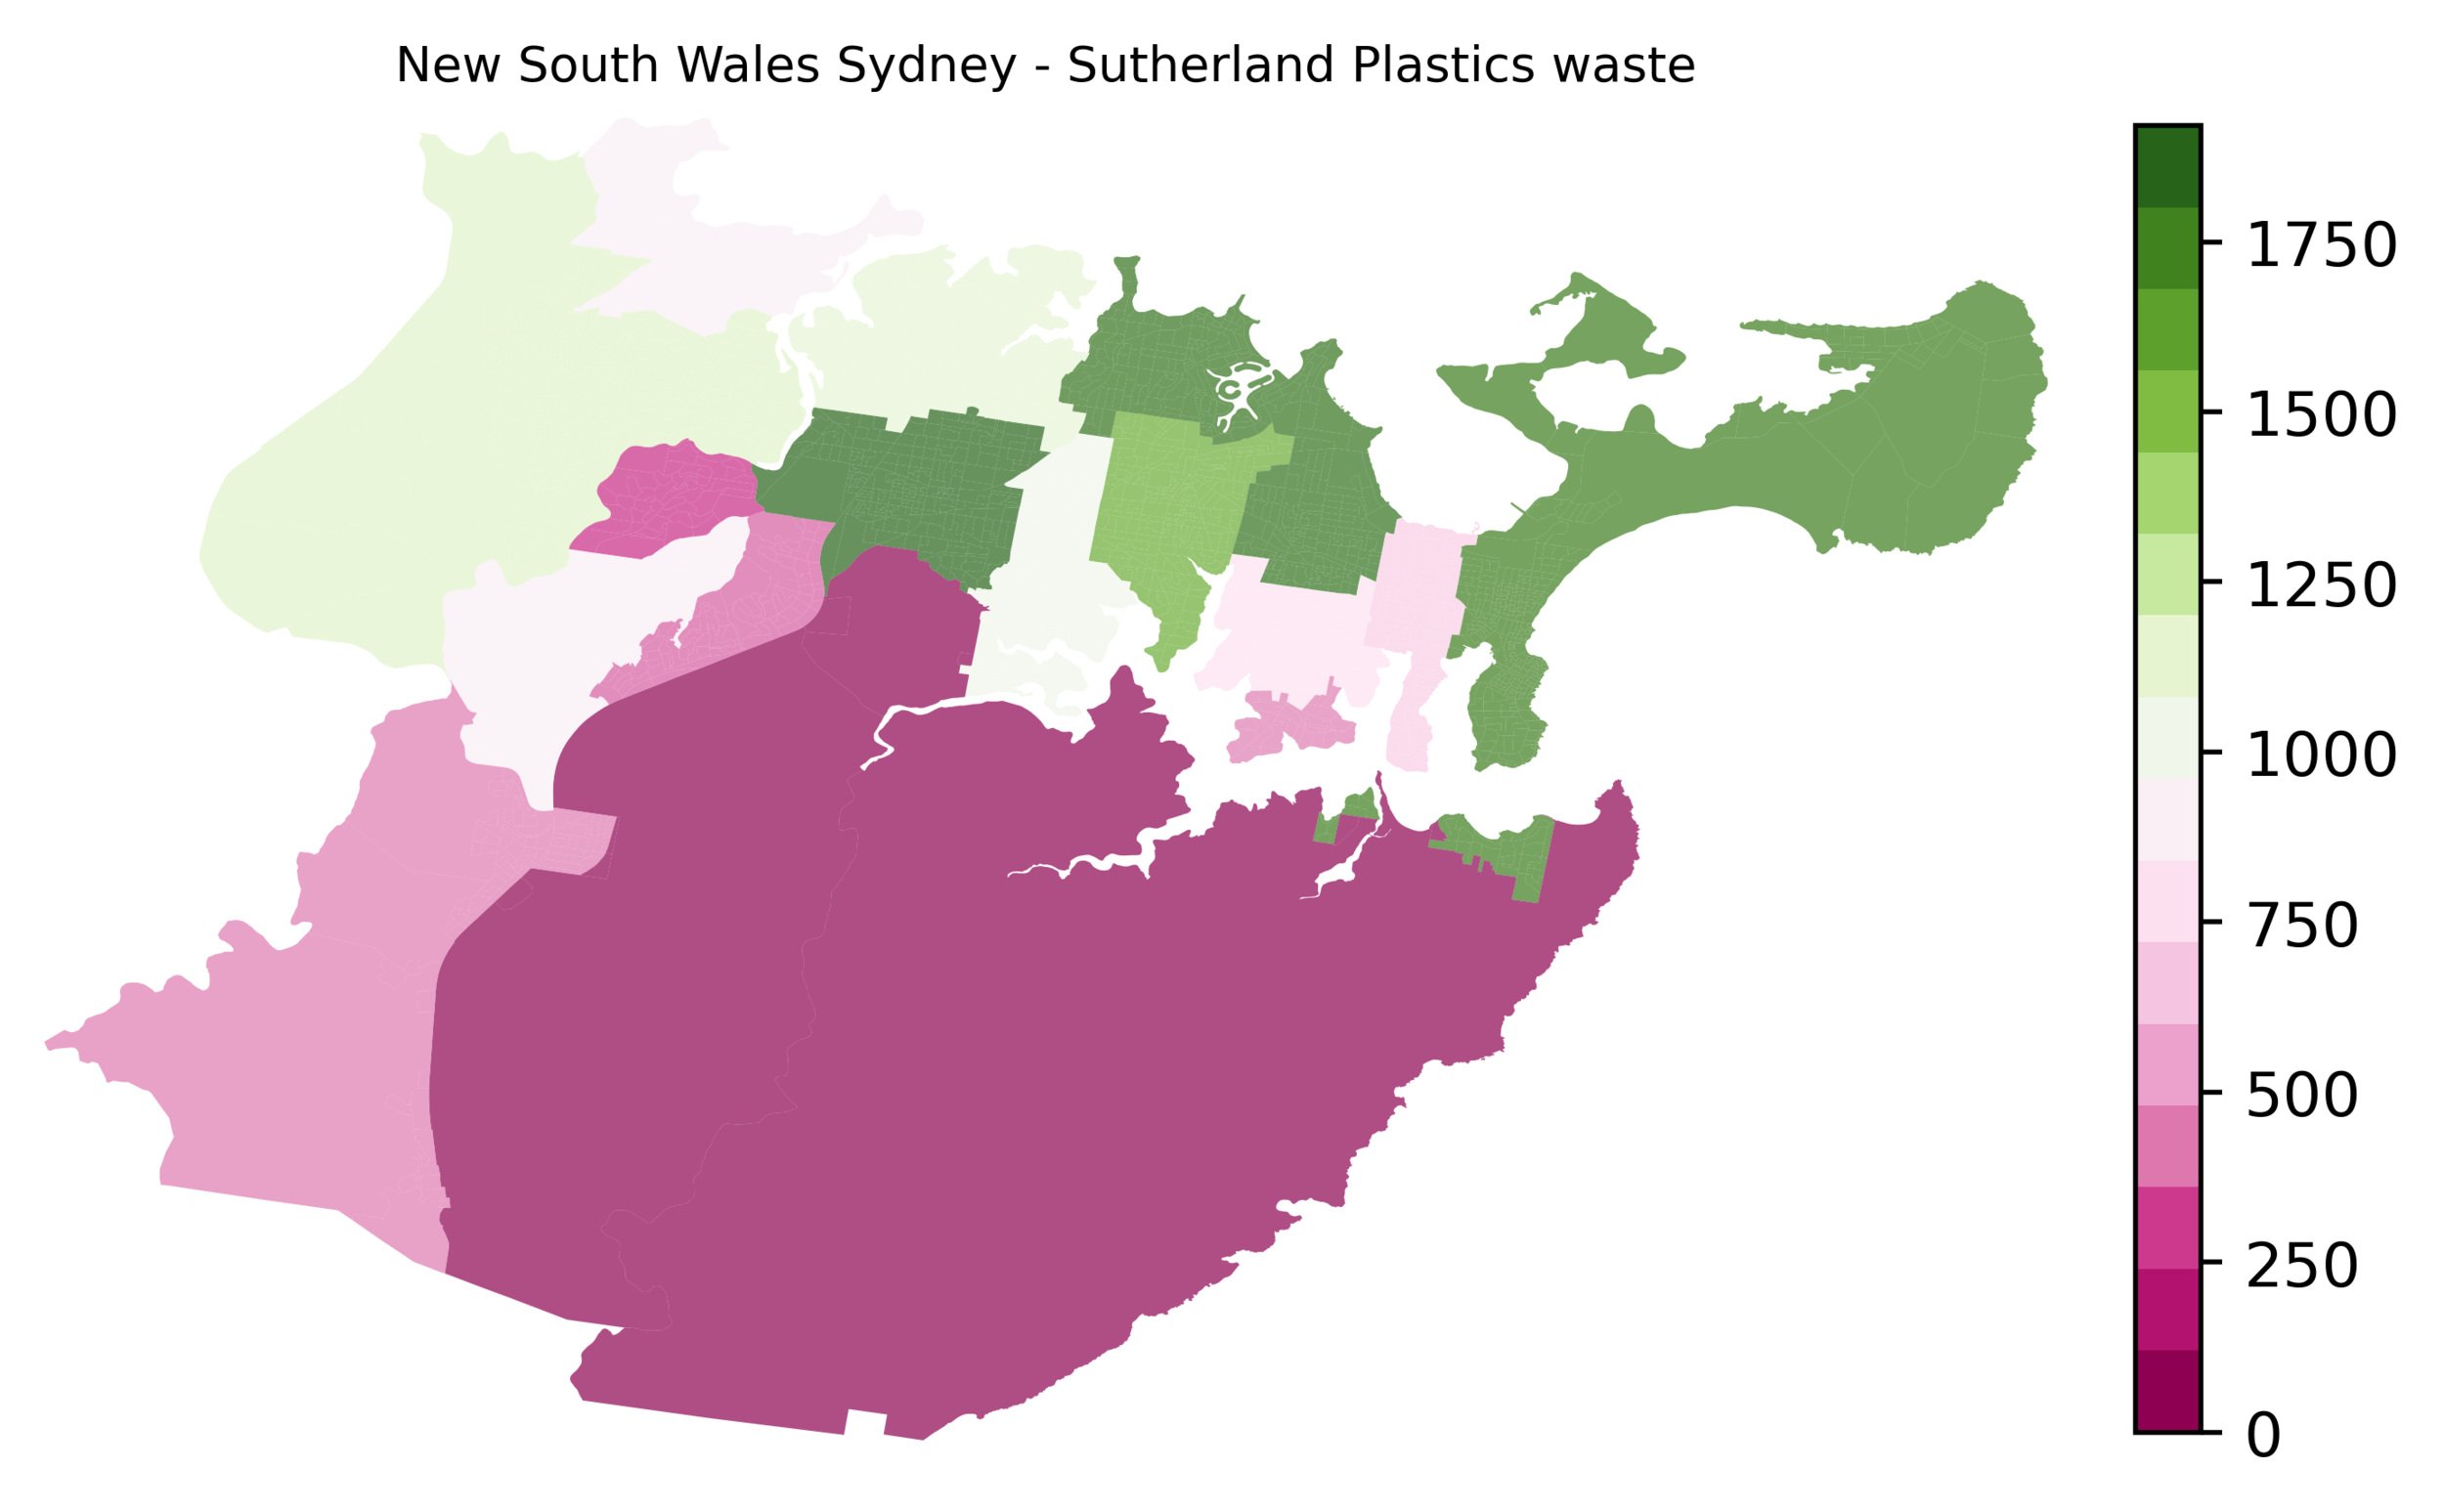
The National Waste Database is a repository for Australia's solid waste data. This collection of waste data is useful however has some issues: The timeseries is not complete, as some years are missing. Allocation to industries is very coarse, there are only 3 waste generating entities: construction and demolition, commercial and industrial, and municipal (households). Further, not all reporting regions (States and Territories) provide data at the same resolution of material type.

We have created an open source dataset in an attempt to solve some of these issues. Missing years are filled using linear interpolation. The regional resolution is disaggregated to SA2 regions using the ABS Business Register. Municipal (households) waste is split into SA2s from state totals using population. The ABS Waste Account is used to establish a relationship between waste types and generating sectors.

The data is published in both sparse tensor flat file formats. The dataset dimensions are:
- years: 2007 - 2019,
- regions: 2310 SA2 (2016) ASGS regions,
- entities: 115 generating entities; 114 SUPG (supply-use product group) industries + 1 households,
- waste types: 69 waste material types,
- treatments: 5 waste treatment methods


The dataset is available here for download: https://zenodo.org/record/5646740, and is made available under a Creative Commons Attribution 4.0 International License.


Circular economy models

Physical input-output models (PIOTs) provide a map of physical flows within economies and also between the economy and natural environment. PIOTs can be used to assess progress towards the circular economy by mapping material cycles within economies. However, these models can be difficult because physical data describing the economy is usually less detailed than monetary data, physical production data is often limited in the number of products covered, timeseries information contains gaps and data classifications change. We did some work to construct some PIOTs for Australia. The data limitations were overcome using an optimisation procedure that uses information from all published data sources and applies a conservation of mass principle.

Figure1.png

The diagram below is shows simplified material in the PIOTs. The capital account is exogenous to the PIOT while interacting with it by acting as a sink for materials in new construction and a source of material from demolitions. RoW: rest of the world, RoE: rest of the economy. Once extracted from nature, some materials flow through the human-economy very quickly while others reside for extended periods, embedded in structures. However in the long-term, these materials embodied in building stock are returned to nature. On a geological time-scale, materials used by the human-economy are endognised to it and will eventually flow back to the natural environment.

One way to imagine the usefulness of PIOTs is to consider the construction industry. In the Australian economy, building construction is a significant driver of material consumption. If the magnitude and composition of these material flows were known, future resource requirements for building stock growth could be predicted. In addition, the availability of waste products from the dismantling of building stocks for use as inputs to new structures could be estimated. We could also determine if the domestic recycling infrastructure is sufficient to recover these wastes, and whether there are markets for recycled products.

In a circular economy, we are very interested in the flow of waste and secondary products back into new production. When waste displaces virgin material extraction from nature, many environmental impacts are avoided. Whether the substitution of waste for virgin material occurs in reality depends upon a number of factors, such as the relative costs of production inputs. There are technical limits to substitution, for example a high-quality and uniform glass waste stream is required for use in float-glass manufacturing. Domestic recycling infrastructure must also exist, for example in Australia, there is currently no suitable smelters for metal recovery from electrical and electronic equipment (e-waste) so this waste is exported internationally. The existence of domestic industries to soak-up the recycled products is also important.

The tables are available here: github.com/spottedquoll/aus-piots, for 1985 to 2012 at a resolution of 150 products/industries.

Resources

Isard, W. (1969). Some Notes on the Linkage of the Ecologic and Economic Systems. Papers in Regional Science, 22(1):85–96.

Duchin, F. and Levine, S. H. (2011). Sectors may use multiple technologies simultaneously: The rectangular choice-of-technology model with binding factor constraints. Economic Systems Research, 23(3):281–302.