supply chains

Transparency, forced labour and sector heterogeneity


Under the Modern Slavery Act of 2018 [1] Australian businesses must report their exposure to modern slavery in their supply chains. However, discovering whether modern slavery exists in complex and global supply chains is difficult, even when businesses are well-motivated. Modern slavery can come in many forms. For example, debt bondage or bonded-labour, can trap workers in coercive situations until a debt is repaid. Workers may also be subjected to wage exploitation, where wages are severely underpaid [2]. Furthermore, the victims of human trafficking may be forced to work and have their passport or visa withheld.

Recently, attempts have been made to trace modern slavery in supply chains using input-output analysis [3,4]. Input-output analysis (IOA) is a powerful technique for tracing impacts along supply chains and has been used to successfully calculate carbon footprints. However, these supply chain analyses may be somewhat fraught when used to trace modern slavery.

By its’ nature, modern slavery is illicit and occurs in the shadows. This means that modern slavery data is scant, incomplete and often published with high uncertainty. Modern slavery auditors can conduct factory inspections to check for slavery-like conditions, however it’s not clear how results from specific factories can be used to make generalisation about whole sectors or industries. Other datasets and indicators are potentially correlated with modern slavery, for example skill, income, access to education and employment opportunities, access to trade unions and freedom to associate. Unfortunately, using inequality as an indicator risks painting all nations with high inequality, often in the global south, as complicit in modern slavery.

One assumption of IOA theory is that the firms within a sector are generally similar or homogeneous with respect to their direct intensity qj. That is, the direct intensity qj of an individual firm is similar to the group of firms comprising the sector. For the case of GHG impacts, we expect firms within a sector to have roughly comparable qj values since emissions generation is strongly influenced by technology and thermodynamic limits.

However for impacts that are sparsely distributed among firms, such as modern slavery, this assumption of sector homogeneity breaks down. Most firms will contribute zero to the sector's total impact, with perhaps only several firms contributing non-zero intensities. The implication of this is that the majority of the sector's output is not associated with modern slavery and the majority of the firms in the sector are not responsible for it. This makes it difficult to interpret footprint results implicating this sector in modern slavery.

The issue of sector heterogeneity can also be seen in the light of aggregation error. Aggregation error occurs when dissimilar firms are aggregated into the same sector within an IO model. With more information we could disaggregate the 'sparse polluters' from the rest of the sector. In fact, statistical offices and IOT compilers will create new sectors when technology and production recipes vary greatly within existing sectors, for example splitting coal-fired and hydroelectric from all electricity generation. However there is not enough information to perform this disaggregation in the case of modern slavery.

Despite these challenges, there are still tools available to improve supply chain transparency. For example, the freight and logistics industries have developed a number of technologies [5] to improve transparency in cold-chain logistics to prevent food wastage, reduce supply chain disruptions and to provide proof of cold-chain breaches. Unfortunately freight transport can also be a conduit for human trafficking and facilitate modern slavery. Transparency of container access can help mitigate this risk, as well as other issues such as product loss through pilfering. Another aspect to transparency is who reaps the rewards of our consumption. In some cases the lower order production layers, such as retailing, can gobble up a large fraction of total product cost and the workers at higher production layers remain lowly paid [6].

[1] Modern Slavery Act: https://www.legislation.gov.au/Details/C2018A00153

[2] https://www.governmentnews.com.au/migrants-trapped-in-slave-like-conditions-at-aussie-farms/

[3] Shilling et al., 2021, Modern slavery footprints in global supply chains, Journal of Industrial Ecology

[4] https://www.sydney.edu.au/science/our-research/research-areas/physics/big-data-combatting-modern-slavery.html

[5] Such as: https://opensc.org/, https://www.cargoai.co/, https://www.enkibox.com.au/
[6] https://theconversation.com/it-would-cost-you-20-cents-more-per-t-shirt-to-pay-an-indian-worker-a-living-wage-88309

Supply chain abstraction and reality

An abstraction layer is a thinking tool that enables us to temporarily ignore some parts of a problem. Thinking in terms of abstraction layers allows an engineer or scientist or any problem solver to focus on a specific aspect of a problem, as the wider environment and associated complexity is temporarily ignored. The language of abstraction layers is common in software engineering and computer science, where many libraries, frameworks and protocols sit atop one another [1].

One example of an abstraction is buying our food from the supermarket. All of the underlying physical reality and complexity of growing food, keeping it fresh and transporting it from the farm to market is more-or-less abstracted away from the consumer. However at some point, these abstractions begin to break down or to “leak”, in fact it has been posited that all abstractions end up leaking to some degree [2]. The supermarket abstraction begins to leak, for example, when a global pandemic hits food supply chains and consumers find the supermarket shelves empty. When this happens the consumer is forced to consider; where does all this food come from anyway, and should I grow my own food? The leak in the abstraction has laid reality bare.

The science of sustainability often involves attempts to reveal the physical reality that has been obscured by abstraction. Here the abstraction is created by our industrialised and consumerist society, whereby the consumer is disconnected from the manufacture of goods and services, and the entailing environmental degradation [3]. This disconnection comes about due to the complex and interconnected nature of global production and trade, as well as the pattern of shifting or ‘externalising’ pollution to other countries or regions – where the impacts are out of sight [4].

There are modelling techniques available that can unravel the complex web of inputs and impacts along global supply chains [5]. These techniques attempt to account for all the processes that contribute to the goods and services we consume. This allows environmental impacts to be traced to specific consumption activities, despite the impacts and consumption events being separated in time and space.

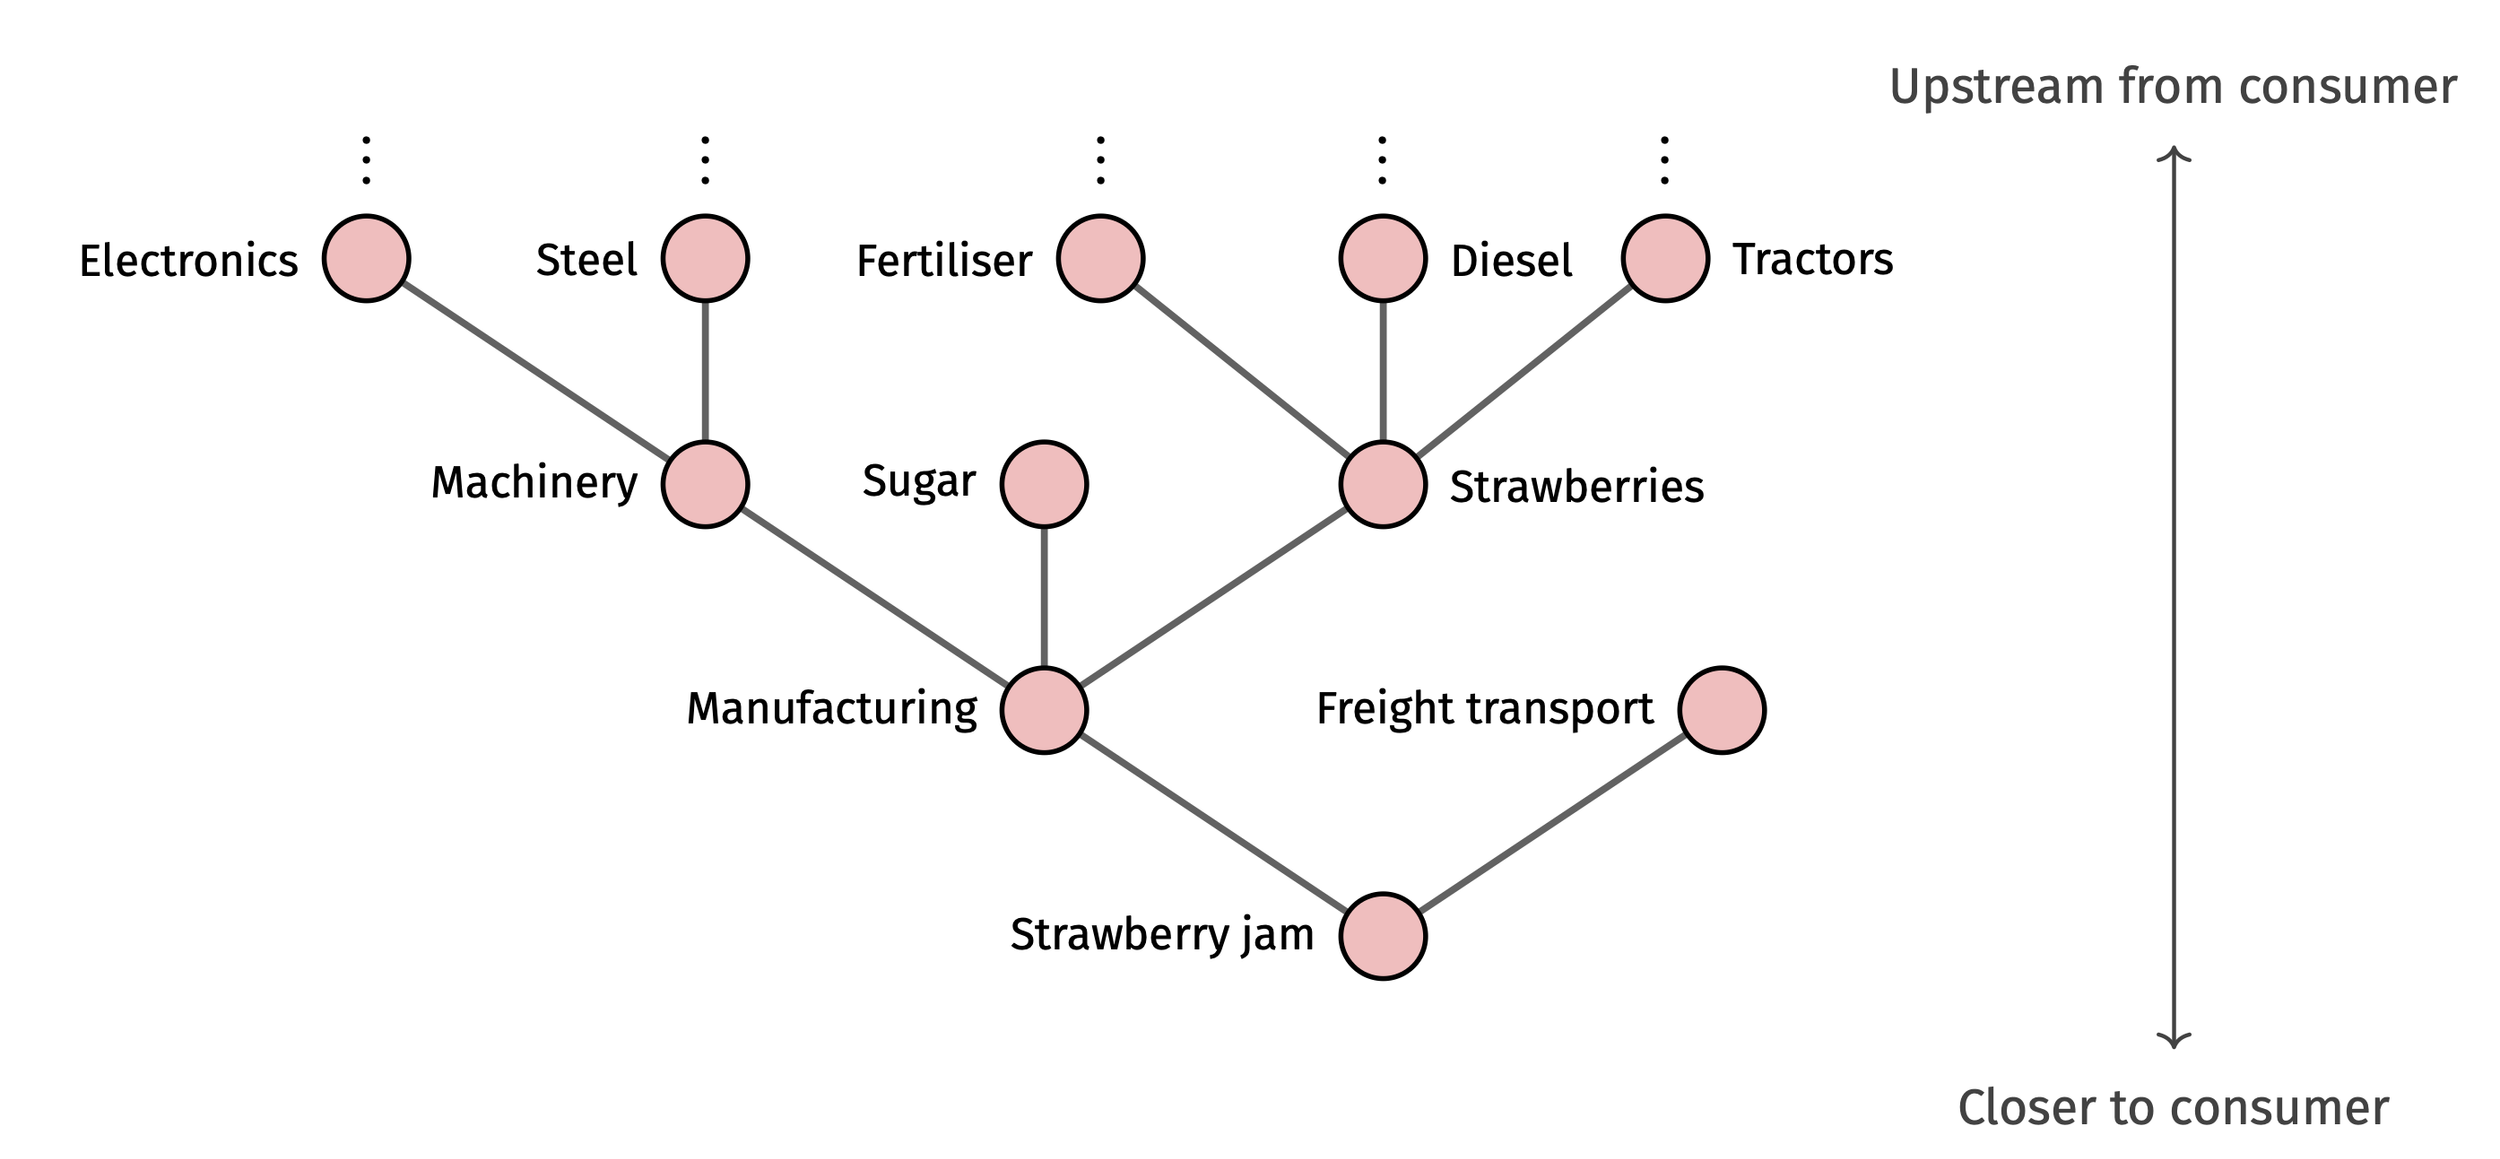
Using these models allows us to peel-back the production layers and traverse the supply chain, hopefully revealing more of the underlying physical reality. This is demonstrated in the fictitious strawberry jam supply chain shown above. Each step away from the consumer upstream reveals another production layer and set of inputs. These techniques rely on large environmental economic models which knit together the world’s production, trade, consumption and environmental data [6]. The models give us insights into the far fringes of our supply chains, however represent reality only in aggregate – individual supply chains may deviate from those in the model.

Other tools exist to follow goods along supply chains in real-time, and have applications in the freight transport, fishing, cold-chain and food industries [7]. These tools come under the broad heading of supply-chain transparency and chain-of-custody techniques [8]. These techniques differ from the supply chain models in that they usually track an individual product, rather than attempting to account for the innumerable contributing components to a complex product.

These tools are all attempts to reconstruct the past of a product and provide consumers better information about the real costs and environmental impacts of their purchases. However, perhaps this strategy has limits: we may not be able to unravel the full impacts of our actions in the world and therefore should tread as lightly as possible.

[1] See for example, https://en.wikipedia.org/wiki/Fundamental_theorem_of_software_engineering

[2] https://www.joelonsoftware.com/2002/11/11/the-law-of-leaky-abstractions/

[3] Erb at al., 2009, Embodied HANPP: Mapping the spatial disconnect between global biomass production and consumption, Ecological Economics

[4] Peters, G et al., 2011, Growth in emission transfers via international trade from 1990 to 2008, PNAS

[5] Techniques such as Input-output Analysis and Life Cycle Assessment.

[6] These databases include EXIOBASE, GLORIA, EORA and others.

[7] See for example: https://www.enkibox.com.au/, https://opensc.org/.

[8] https://hbr.org/2019/08/what-supply-chain-transparency-really-means

This post first appeared on the Shrunk Labs blog: https://shrunk.ai/blog/f/supply-chain-abstraction-and-reality

Supply chain tools for modern slavery

In 2018, Australia passed into the law the Modern Slavery Act, requiring companies to investigate and report on modern slavery in their supply chains. [1]

The OAASIS [2] project (the Open Analysis of Slavery in Supply Chains) aims to harness the power of input-output analysis to assist companies and governments to understand how slavery is embodied in the supply chains of goods and services that Australian's consume. OAASIS hopes also to build tools that help companies comply with the Act.

Part of this work is to assemble and compile a collection of tools that can be used to calculate modern slavery footprints. For example the make-labour-satellite python repo (https://github.com/modern-slavery-open-lib/make-labour-satellite) reads in several modern-slavery and 'problematic labour' datasets and casts them to the GLORIA MRIO [3] classification - enabling them to be used with GLORIA to calculate footprints [4]. The first datasets we have added is from Shilling (2021) [5] and also the ILO [6].

If you would like to be involved, or know of some good labour data, please reach out!

[1]: Modern Slavery Act: https://www.legislation.gov.au/Details/C2018A00153

[2]: The OAASIS project: https://www.sydney.edu.au/science/our-research/research-areas/physics/big-data-combatting-modern-slavery.html

[3]: GLORIA MRIO: https://ielab.info/analyse/gloria

[4]: The data is converted to the GLORIA classfication using the mapping operation: x'(1.p) = x(1.n) Msr(n.m) Msr(m.p)

[5]: Shilling et al., 2021, Modern slavery footprints in global supply chains, Journal of Industrial Ecology, https://doi.org/10.1111/jiec.13169

[6]: International Labour Organization: https://www.ilo.org/global/statistics-and-databases/lang--en/index.htm

Short supply chains

There are some advantages to short, low-complexity supply chains. One advantage is the reduction in abstraction. If the consumer can imagine the place where the product is from, then perhaps the environmental impacts of production become more tangible. Another advantage is the consumer may have more influence over a shorter supply chain. When the producer exists in approximately the same region as the consumer, it may be easier to exert social pressure on the producer to act responsibly.

However, although supply chains may appear “short”, the higher-order production layers are hidden to us. These production layers contain information about the impacts occurring further up the supply chain. For example, in the case of food products, the impacts occurring upstream from the farm in machinery, fuel and chemical manufacturing. The higher-order production layers can be unravelled using environmental-economic models.

While “short” or "simple" may be a useful heuristic, it is not necessarily "better". For example, we could imagine a product that comes from further away but is manufactured using lower-impact production processes than those available locally. In this case the reduction in environmental impacts in production may outweigh the increase in transport emissions and abstraction.

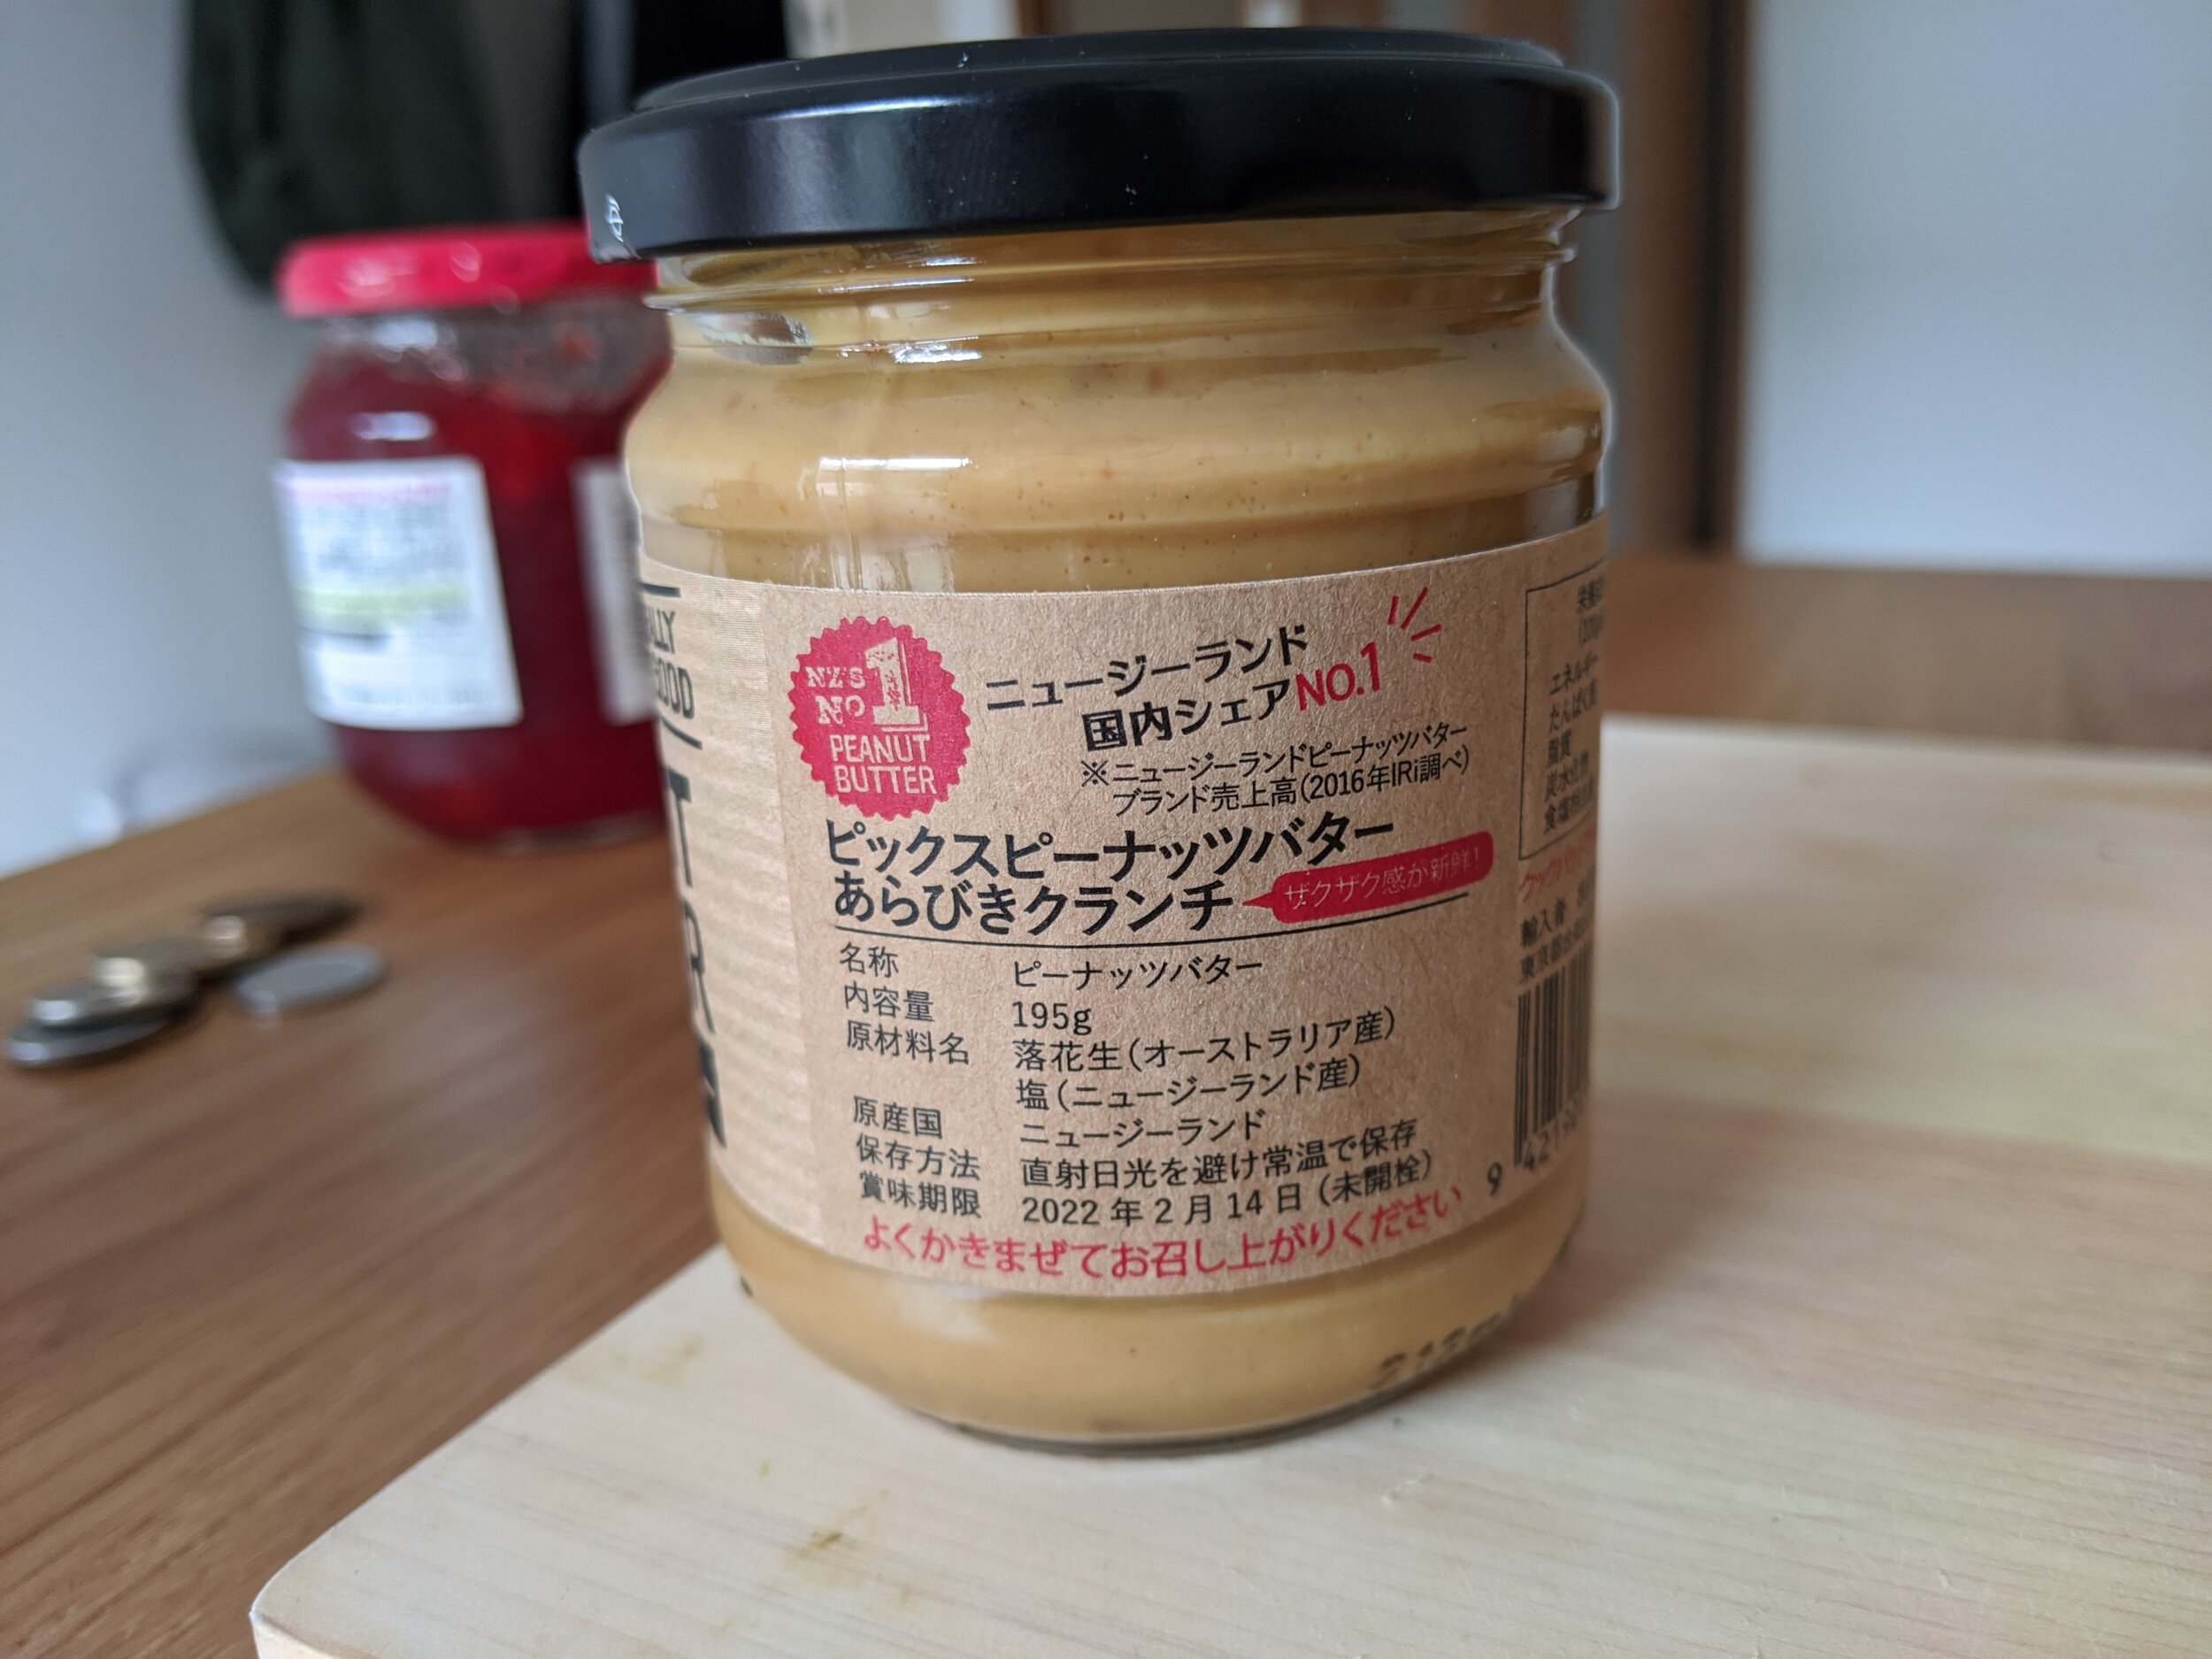
New Zealand peanuts and Australian salt into Japan’s final demand.


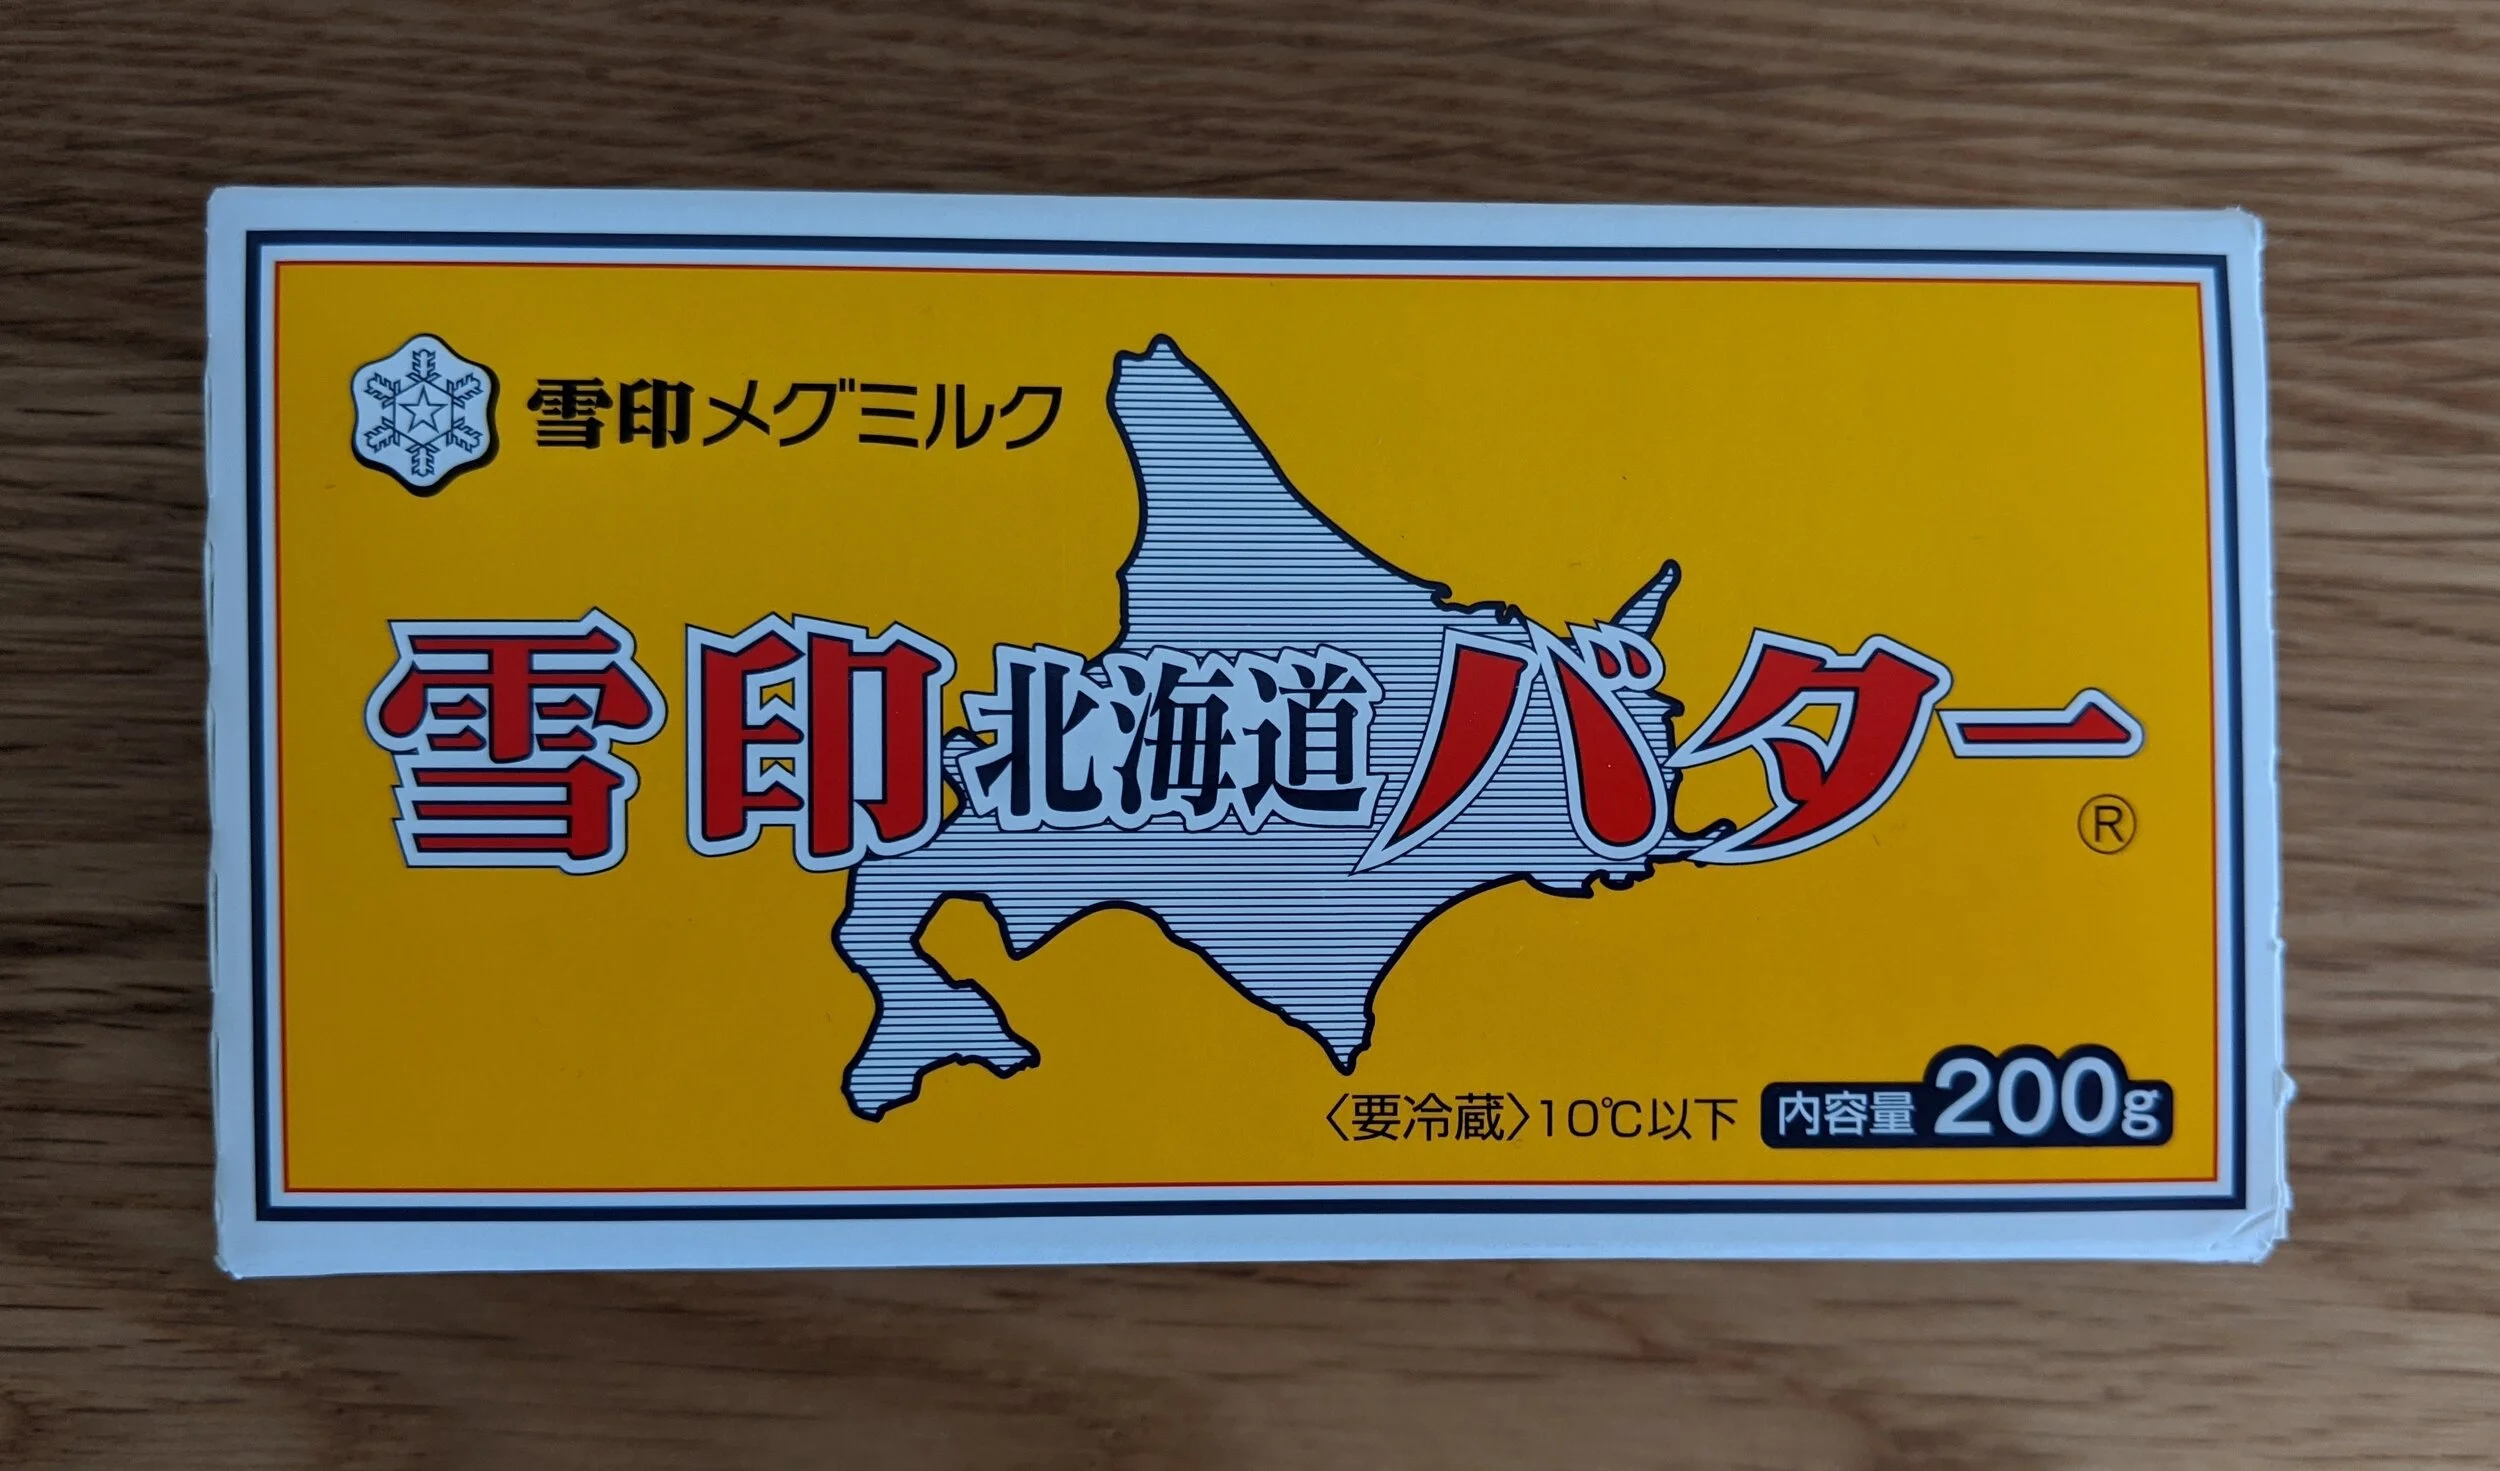
Hokkaido butter


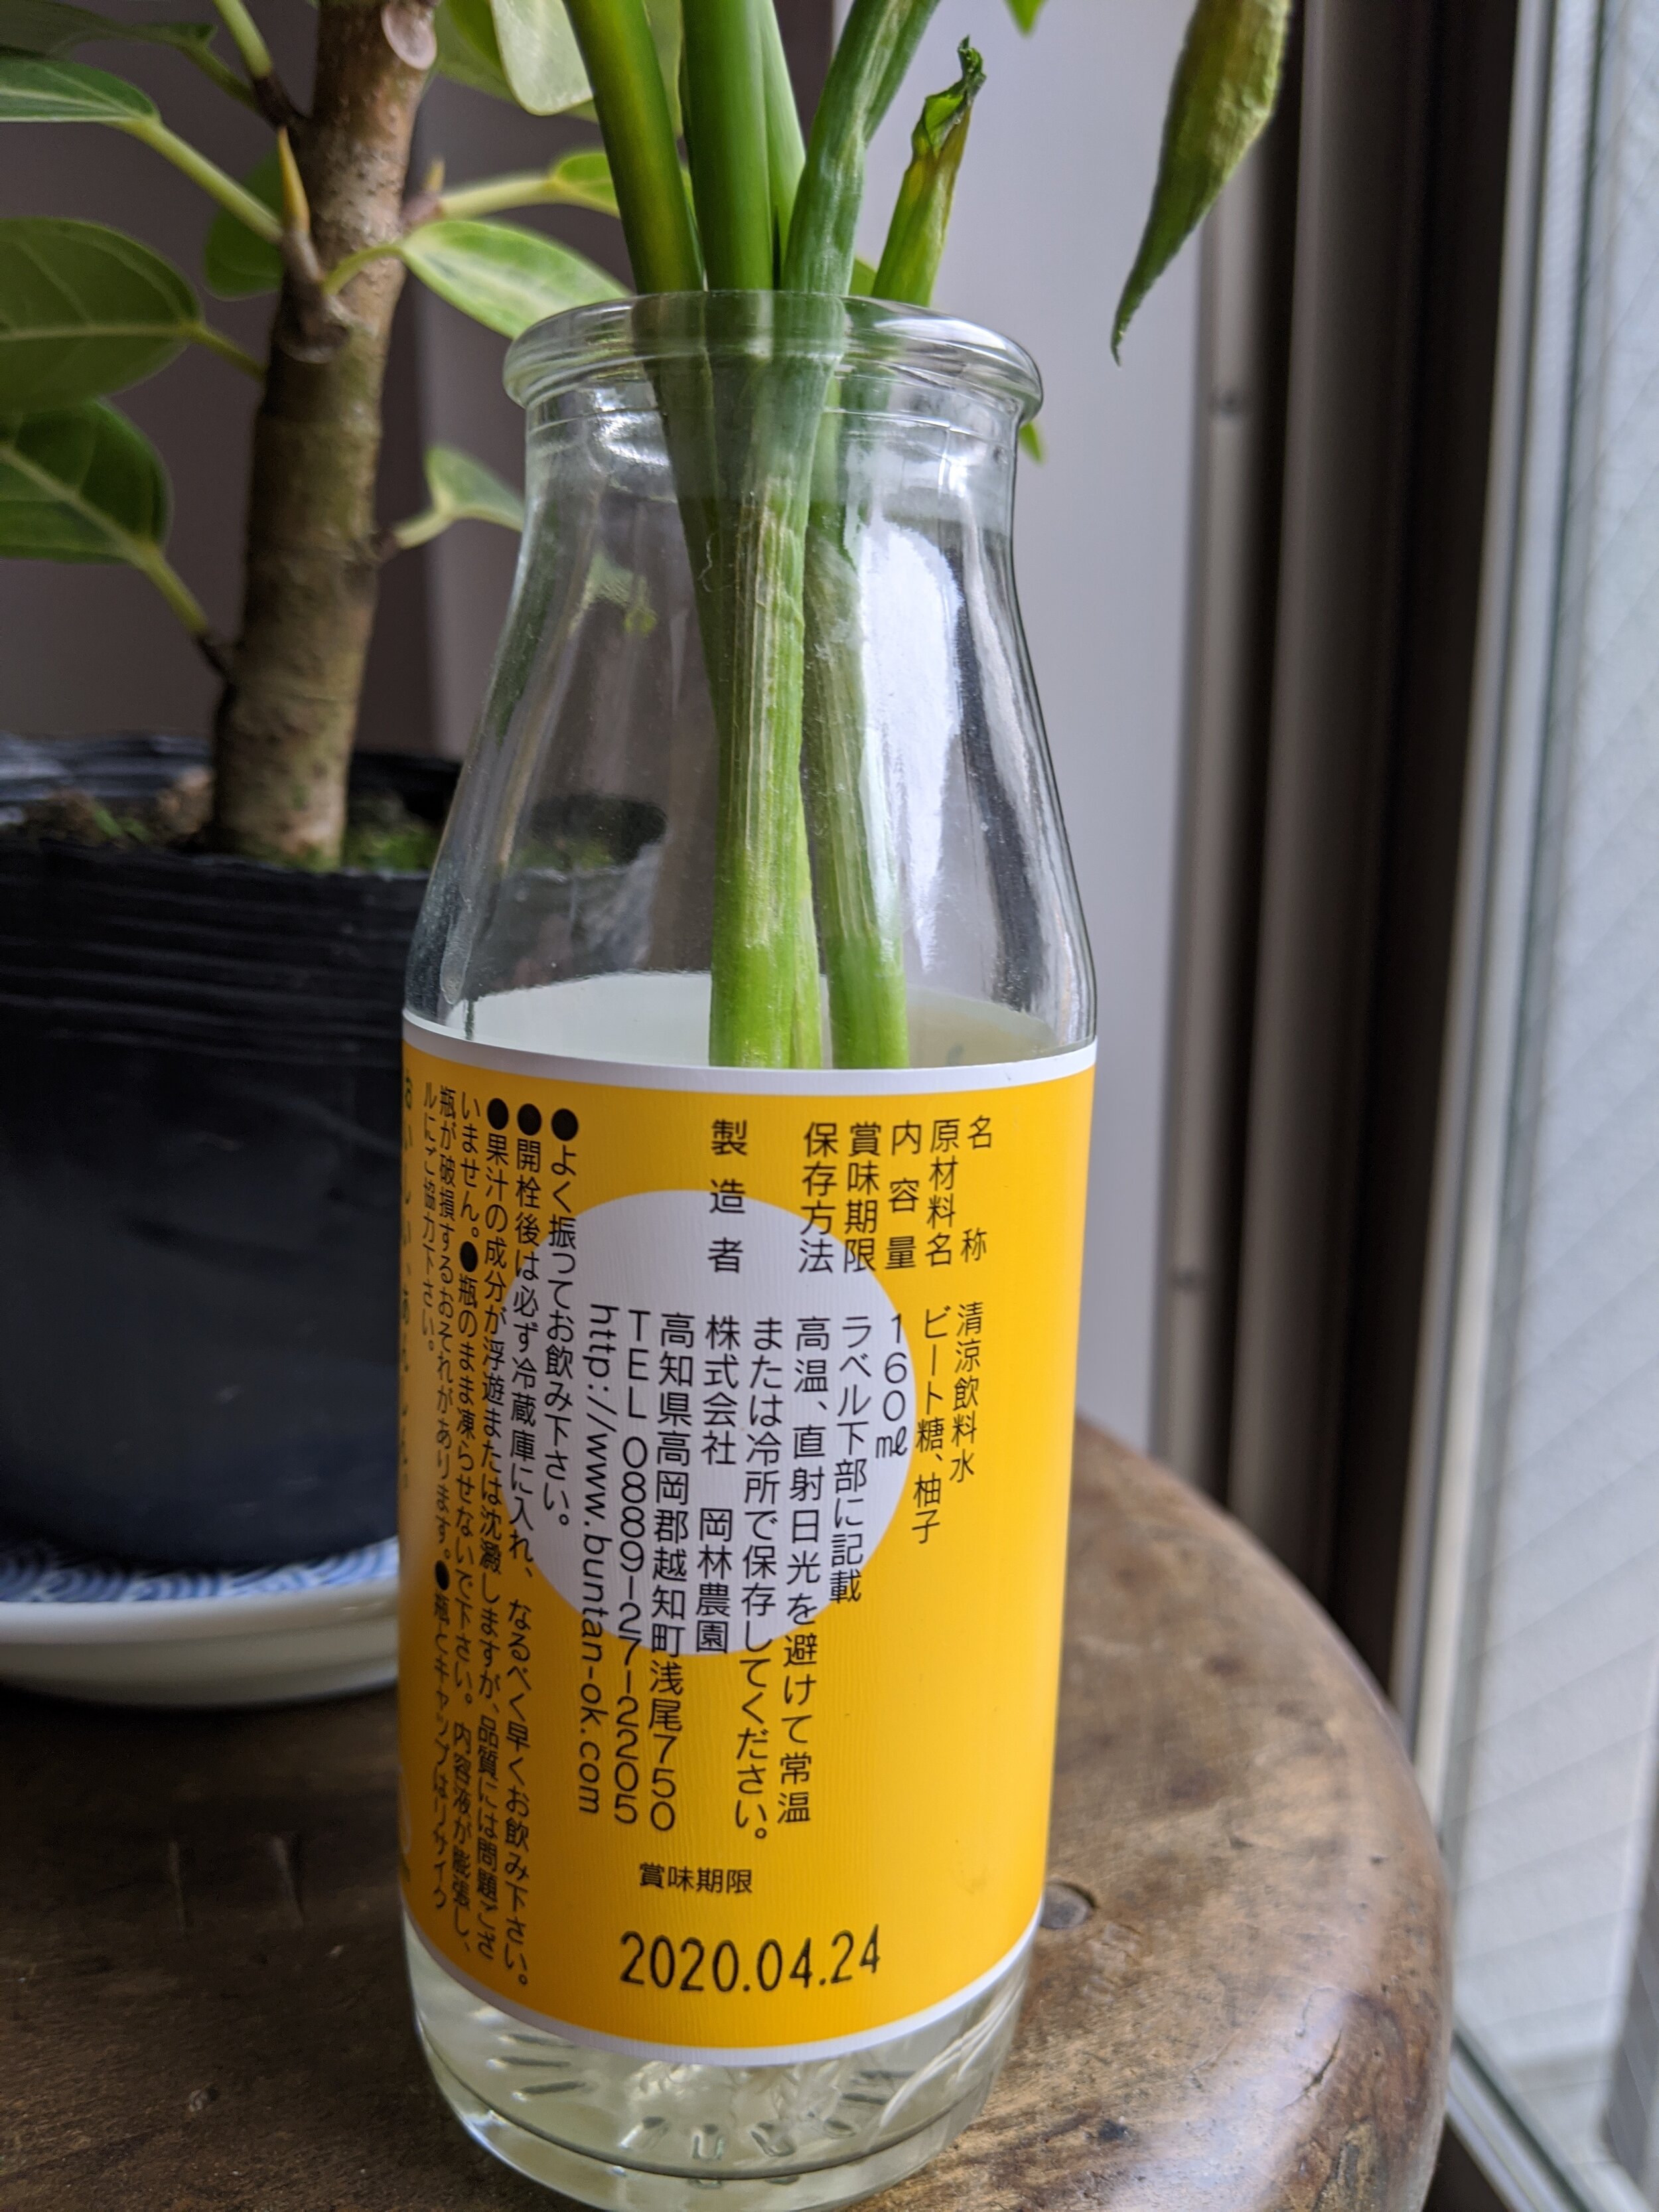
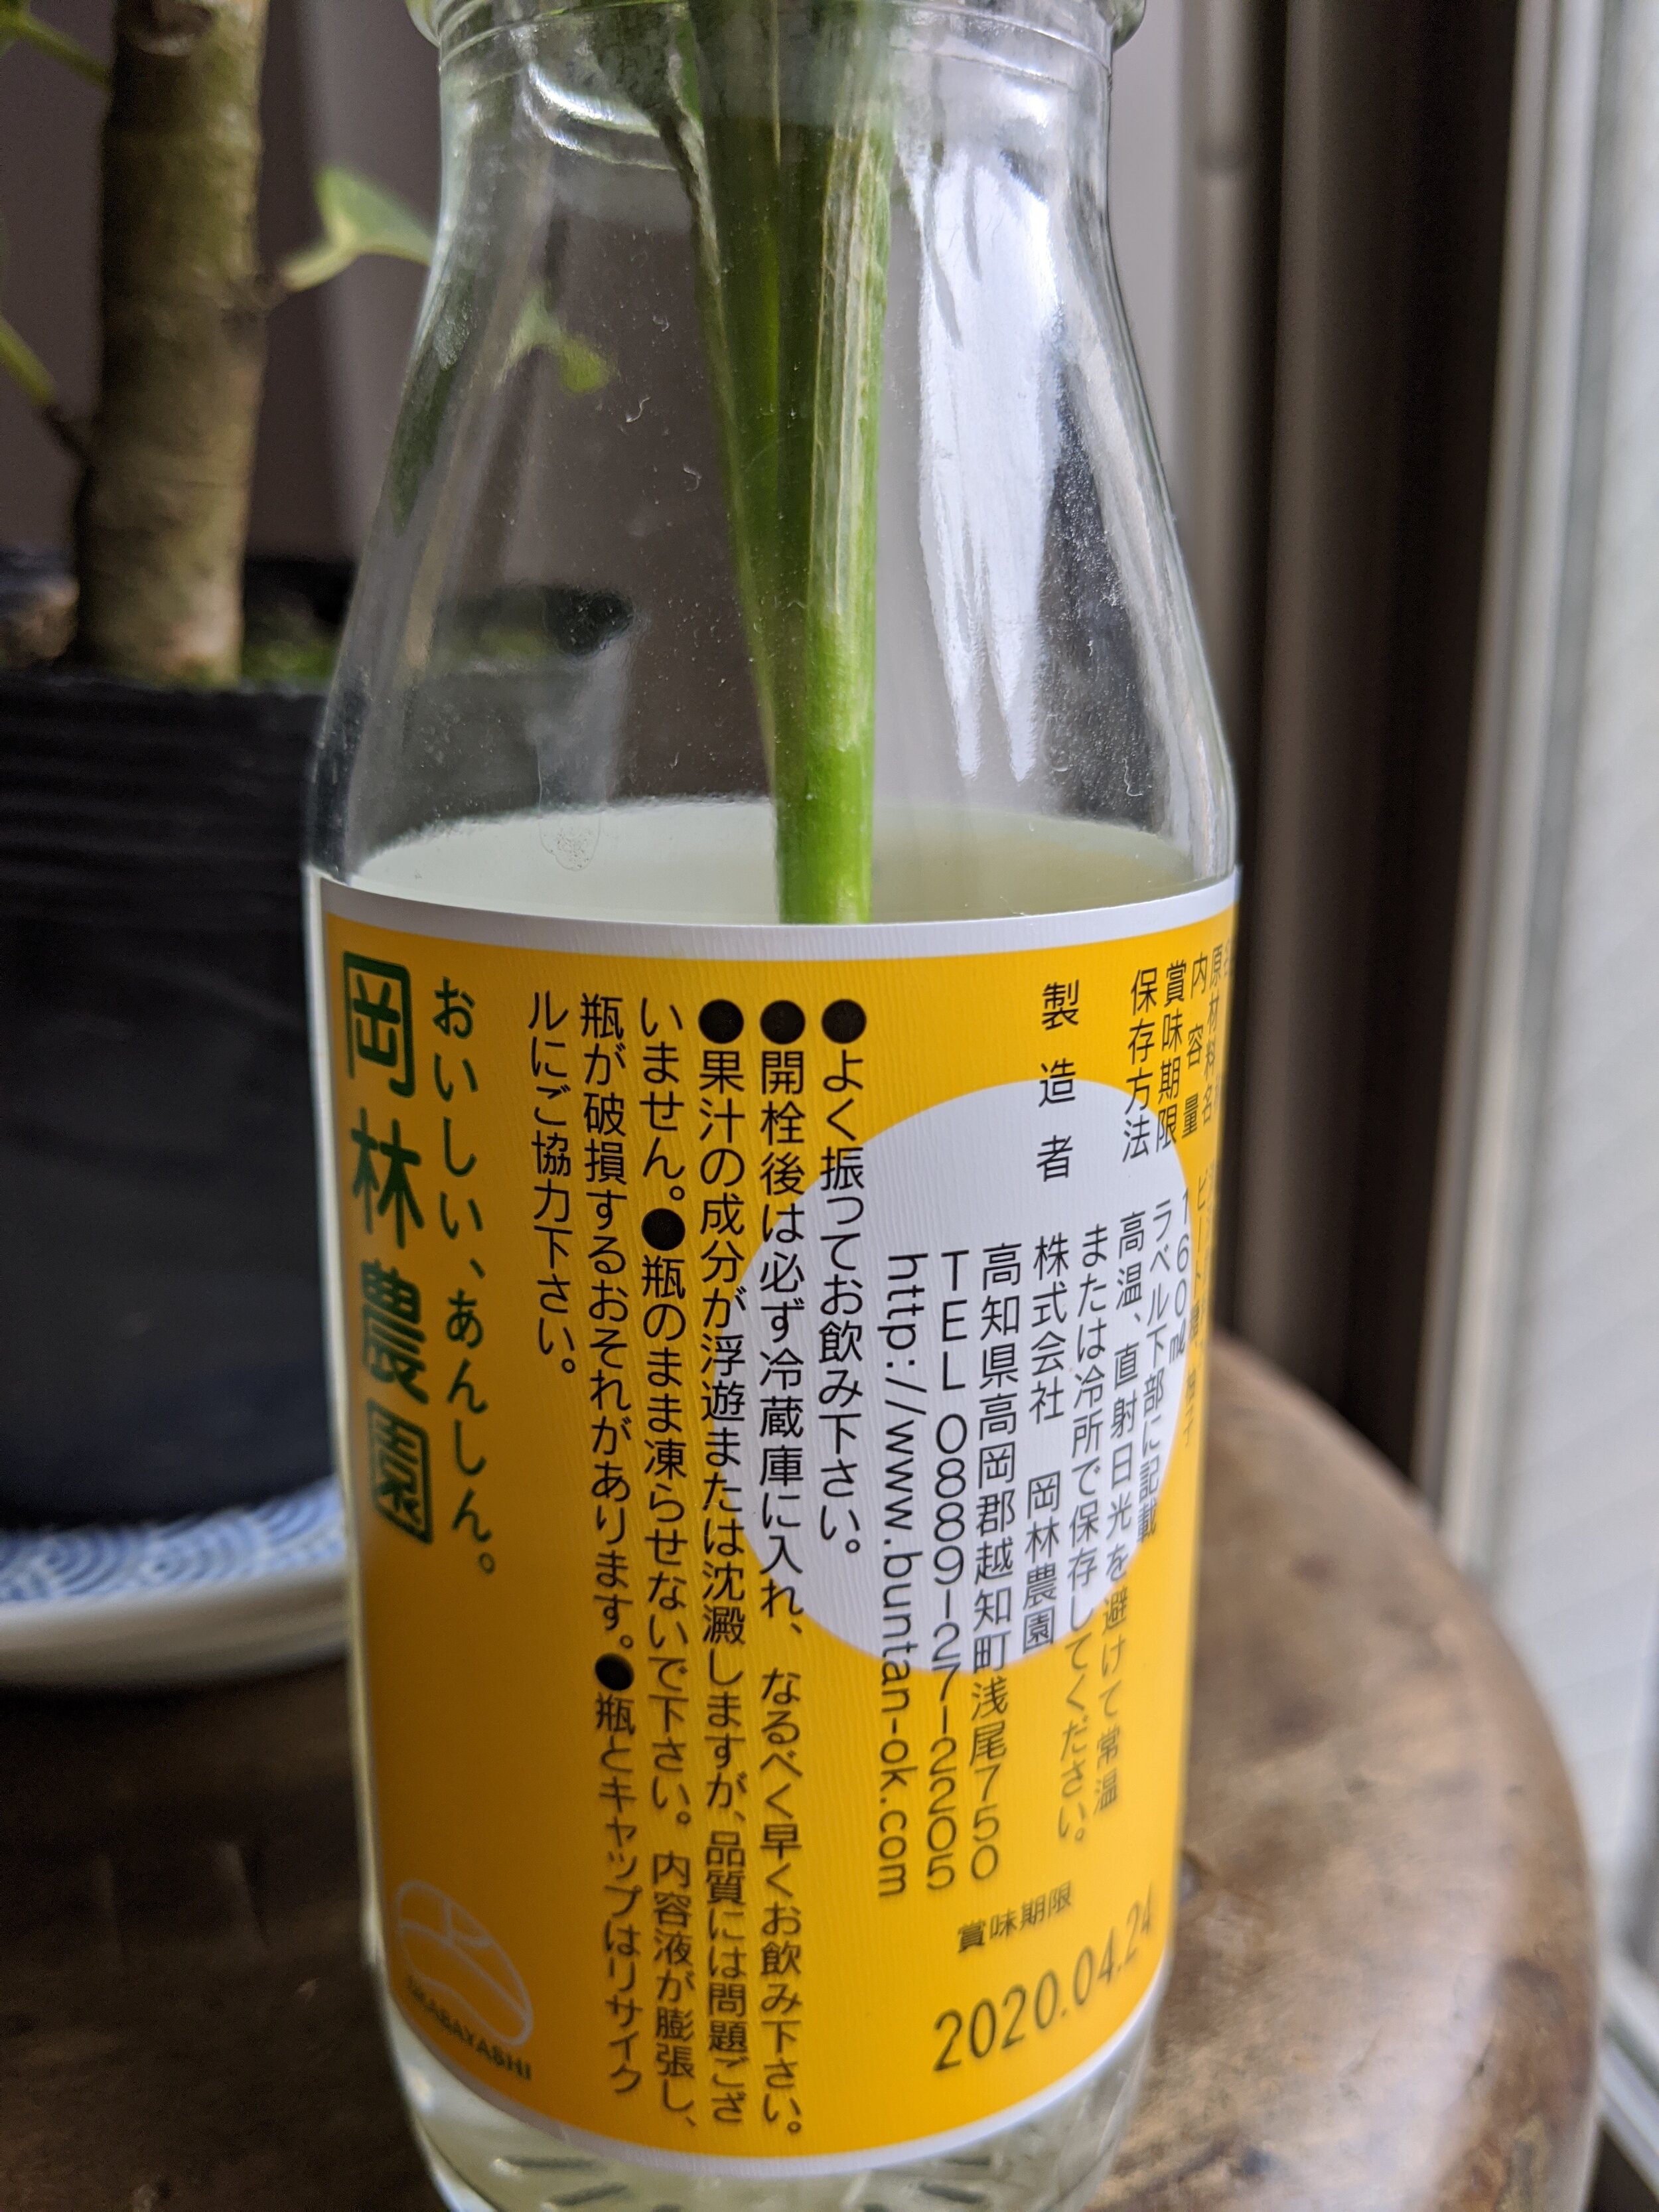
Yuzu (Japanese lemon) and sugar from Kochi


Consumers, deforestation and malaria risk

In a recent paper, we linked malaria and deforestation through supply chains to consumers. Deforestation can increase the transmission of malaria. In this study, we build upon the existing link between malaria risk and deforestation by investigating how the global demand for commodities that increase deforestation can also increase malaria risk. We use a database of trade relationships to link the consumption of deforestation-implicated commodities in developed countries to estimates of country-level malaria risk in developing countries. We estimate that about 20% of the malaria risk in deforestation hotspots is driven by the international trade of deforestation-implicated export commodities, such as timber, wood products, tobacco, cocoa, coffee and cotton. By linking malaria risk to final consumers of commodities, we contribute information to support demand-side policy measures to complement existing malaria control interventions, with co-benefits for reducing deforestation and forest disturbance.

This figure shows trends in forestation, trade in deforestation-implicated products, and post-2000 malaria footprints. Panels (a), (b) and (c) each show a collection of net exporting (magenta) and net importing (green) countries. Axes are logarithmic, with negative values representing deforestation (for example −1 equals a cumulative 10,000 km2 forest loss since 1995) and product import (for example −2 equals a US$100 bn import). Plotted points represent the years between 2000 and 2015 in 3-year intervals where line thickness is proportional to net malaria risk trade, and net exporters represented by a solid line, net importers by a dashed line. The time series proceeds from the origin outwards and also with increasing line thickness. As time progresses, richer countries import more deforestation-implicated products which causes deforestation in poorer countries, while at the same time preserving more of their own forest.